samena found this histogram. which of these best describes the shape of the distribution? choose 1 answer: a…
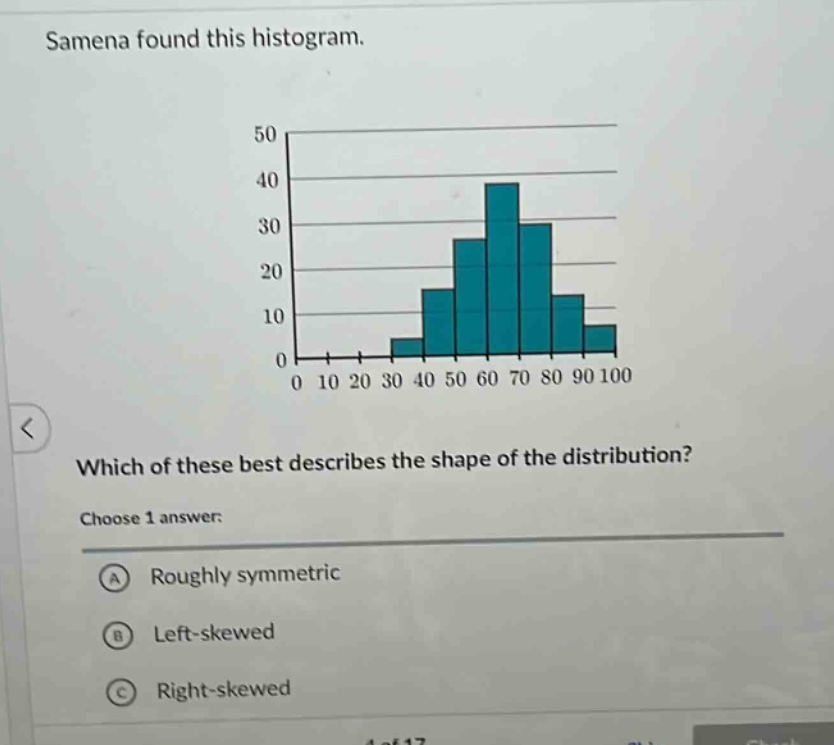
samena found this histogram. which of these best describes the shape of the distribution? choose 1 answer: a roughly symmetric b left - skewed c right - skewed
Answer
Explanation:
Step1: Observe the histogram's shape
Check the symmetry of bars around the center.
Step2: Compare left and right sides
Bars on both sides of the peak (50-60) have similar heights and distribution.
Answer:
A. Roughly symmetric