a sample of 295 people is surveyed. the people are classified according to political affiliation…
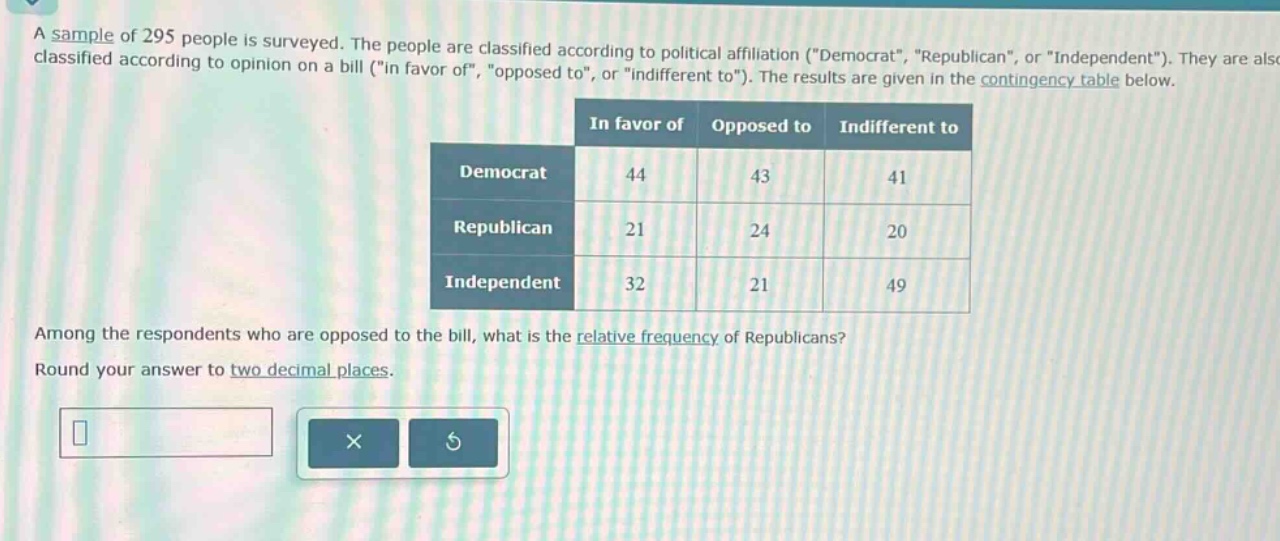
a sample of 295 people is surveyed. the people are classified according to political affiliation (\democrat\, \republican\, or \independent\). they are also classified according to opinion on a bill (\in favor of\, \opposed to\, or \indifferent to\). the results are given in the contingency table below.\n\n| |in favor of|opposed to|indifferent to|\n|--|--|--|--|\n|democrat|44|43|41|\n|republican|21|24|20|\n|independent|32|21|49|\n\namong the respondents who are opposed to the bill, what is the relative frequency of republicans?\nround your answer to two decimal places.
Answer
Explanation:
Step1: Calculate total opposed
Add up the number of people opposed in each political - affiliation group. $43 + 24+21=88$
Step2: Calculate relative frequency of Republicans among opposed
The number of Republicans opposed is 24. Divide the number of Republicans opposed by the total number of people opposed. $\frac{24}{88}\approx0.27$
Answer:
$0.27$