the sample means for three samples of 20 are shown in the table. compute the variation of each predicted…
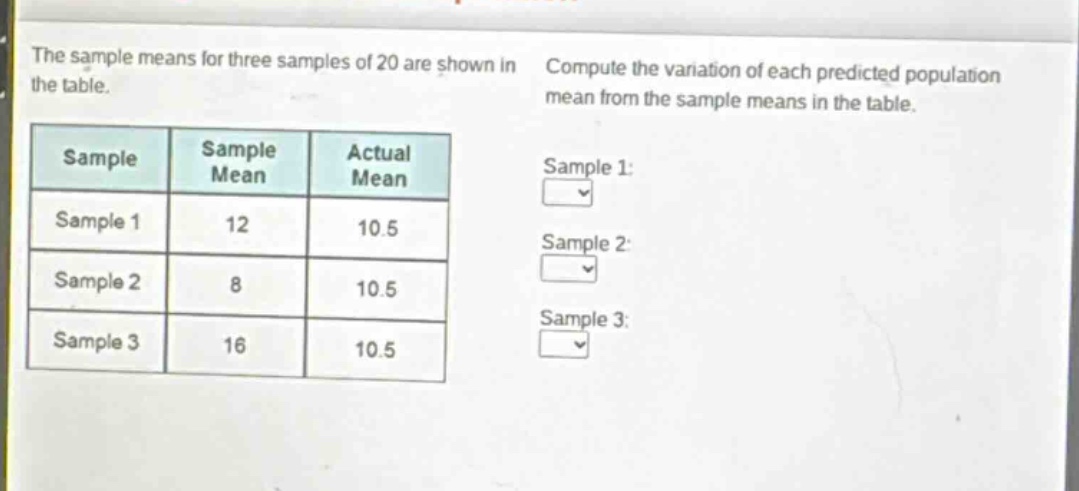
the sample means for three samples of 20 are shown in the table. compute the variation of each predicted population mean from the sample means in the table.\n| sample | sample mean | actual mean |\n| ---- | ---- | ---- |\n| sample 1 | 12 | 10.5 |\n| sample 2 | 8 | 10.5 |\n| sample 3 | 16 | 10.5 |\nsample 1:\nsample 2:\nsample 3:
Answer
Explanation:
Step1: Recall the formula for variation
Variation = Sample Mean - Actual Mean
Step2: Calculate variation for Sample 1
$12 - 10.5=1.5$
Step3: Calculate variation for Sample 2
$8 - 10.5=- 2.5$
Step4: Calculate variation for Sample 3
$16 - 10.5 = 5.5$
Answer:
Sample 1: $1.5$ Sample 2: $-2.5$ Sample 3: $5.5$