a scatter - plot consists of (1, 4.0), (2, 3.3), (3, 3.8), (4, 2.6), and (5, 2.7). the line of best fit used…
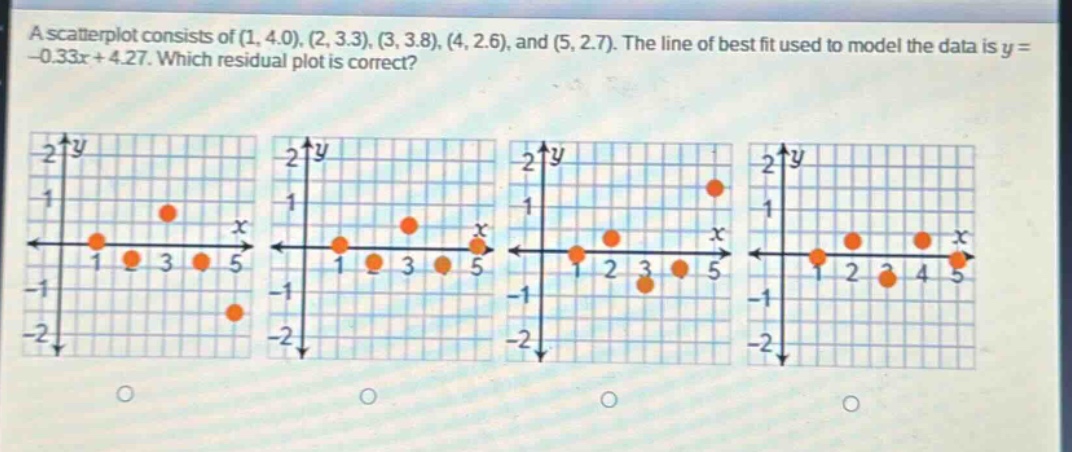
a scatter - plot consists of (1, 4.0), (2, 3.3), (3, 3.8), (4, 2.6), and (5, 2.7). the line of best fit used to model the data is y=-0.33x + 4.27. which residual plot is correct?
Answer
Explanation:
Step1: Recall residual formula
Residual = Observed - Predicted.
Step2: Calculate predicted values
For $x = 1$, $y_{pred}=-0.33\times1 + 4.27=3.94$. Residual for $(1,4.0)$ is $4.0 - 3.94 = 0.06$. For $x = 2$, $y_{pred}=-0.33\times2+4.27 = 3.61$. Residual for $(2,3.3)$ is $3.3 - 3.61=- 0.31$. For $x = 3$, $y_{pred}=-0.33\times3 + 4.27=3.28$. Residual for $(3,3.8)$ is $3.8 - 3.28 = 0.52$. For $x = 4$, $y_{pred}=-0.33\times4+4.27 = 2.95$. Residual for $(4,2.6)$ is $2.6 - 2.95=-0.35$. For $x = 5$, $y_{pred}=-0.33\times5+4.27 = 2.62$. Residual for $(5,2.7)$ is $2.7 - 2.62 = 0.08$.
Step3: Analyze residual plot
We need to plot the points $(1,0.06),(2, - 0.31),(3,0.52),(4,-0.35),(5,0.08)$ on the residual - plot (where $x$ - axis is the $x$ - value from the original data and $y$ - axis is the residual).
Answer:
We would need to visually check which of the given plots has points at the correct $(x,y)$ locations corresponding to the calculated residuals. Without the ability to directly select an option from the visual plots, the process to find the correct plot is as described above by calculating residuals and comparing to the plots.