the scatter plot below contains a set of data points. identify the correlation on the scatter plot.\nshow…
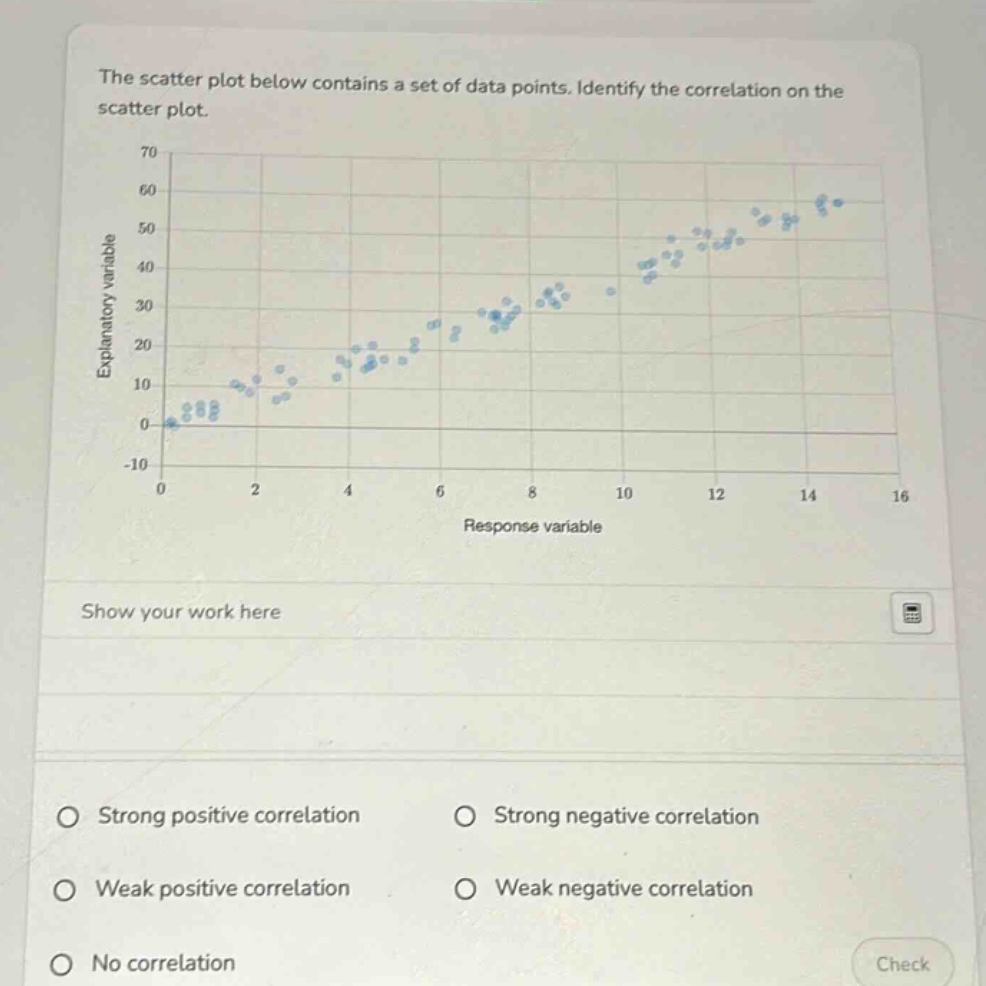
the scatter plot below contains a set of data points. identify the correlation on the scatter plot.\nshow your work here\nstrong positive correlation\nstrong negative correlation\nweak positive correlation\nweak negative correlation\nno correlation
Answer
Explanation:
Step1: Observe the scatter - plot trend
As the response variable increases, the explanatory variable also tends to increase.
Step2: Assess the strength of the correlation
The points are not tightly clustered around a line, so it is not a strong correlation.
Answer:
Weak positive correlation