for the scatter plot given to the right, determine whether an exponential function, a logarithmic function…
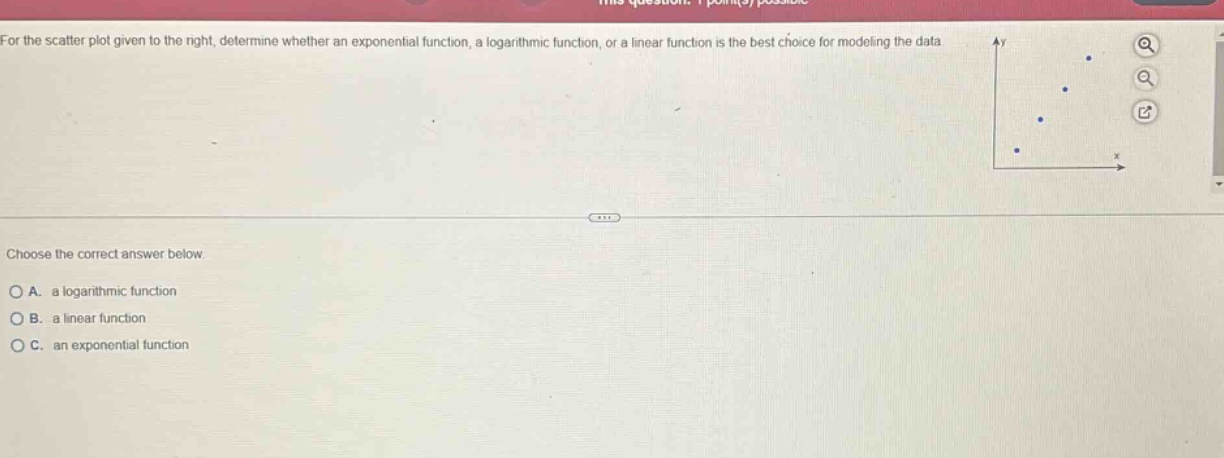
for the scatter plot given to the right, determine whether an exponential function, a logarithmic function, or a linear function is the best choice for modeling the data. choose the correct answer below. a. a logarithmic function b. a linear function c. an exponential function
Answer
Explanation:
Step1: Analyze linear function pattern
A linear - function has a constant rate of change, and its scatter - plot points would roughly form a straight line.
Step2: Analyze exponential function pattern
An exponential function has a rapid increase or decrease. Its scatter - plot would show a curve that gets steeper or shallower quickly.
Step3: Analyze logarithmic function pattern
A logarithmic function has a slow increase or decrease after an initial rapid change. Its scatter - plot has a characteristic curve shape.
Step4: Observe the scatter - plot
From the given scatter - plot, the points seem to roughly form a straight line, indicating a constant rate of change.
Answer:
B. a linear function