the scatter plot and line of best fit below show the length of 10 peoples femur (the long leg bone in the…
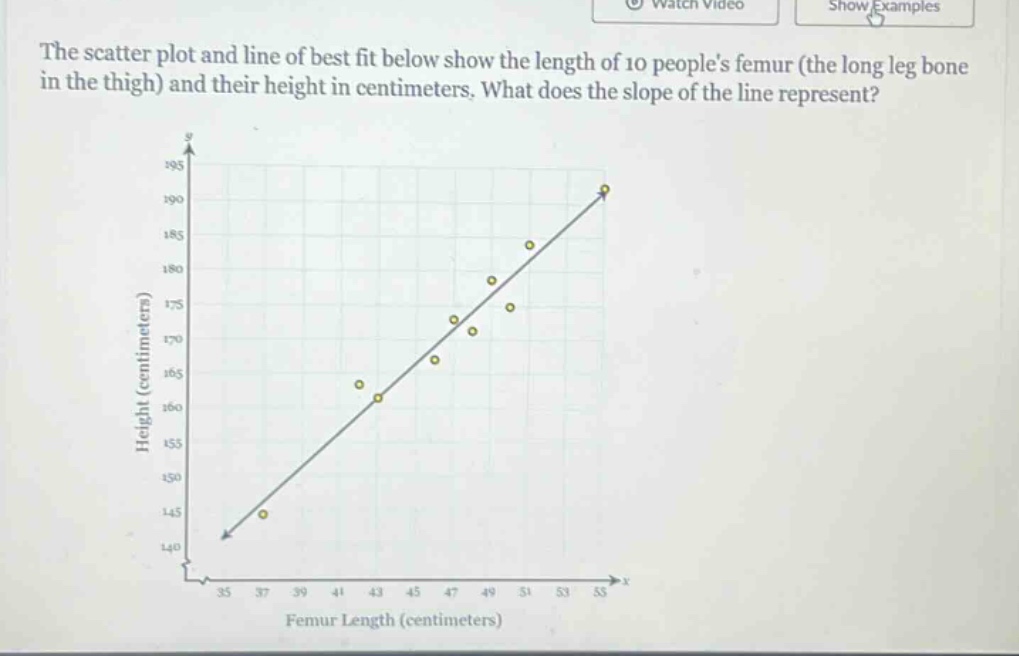
the scatter plot and line of best fit below show the length of 10 peoples femur (the long leg bone in the thigh) and their height in centimeters. what does the slope of the line represent?
Answer
Brief Explanations:
The slope of a line in a scatter - plot with two variables represents the rate of change of the dependent variable (height) with respect to the independent variable (femur length). In this context, it shows how much the height changes for a one - unit increase in femur length.
Answer:
The amount by which height increases for every one - centimeter increase in femur length.