9. a scatter plot of the u.s. national debt from 2001 to 2016, including a linear equation and its residuals…
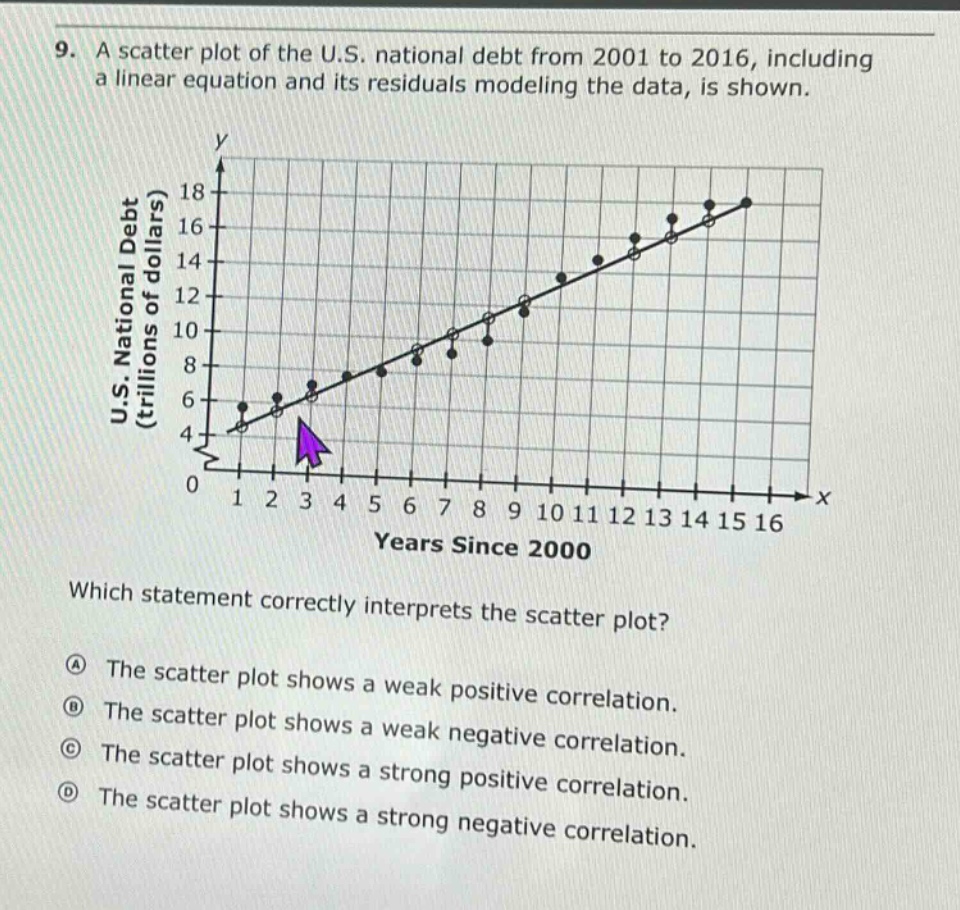
9. a scatter plot of the u.s. national debt from 2001 to 2016, including a linear equation and its residuals modeling the data, is shown. which statement correctly interprets the scatter plot? a the scatter plot shows a weak positive correlation. b the scatter plot shows a weak negative correlation. c the scatter plot shows a strong positive correlation. d the scatter plot shows a strong negative correlation.
Answer
Brief Explanations:
Positive correlation means as one variable (years since 2000) increases, the other (U.S. national debt) also increases. The points in the scatter - plot closely follow an upward - sloping line, indicating a strong relationship.
Answer:
C. The scatter plot shows a strong positive correlation.