which scatter plot does not show an association?
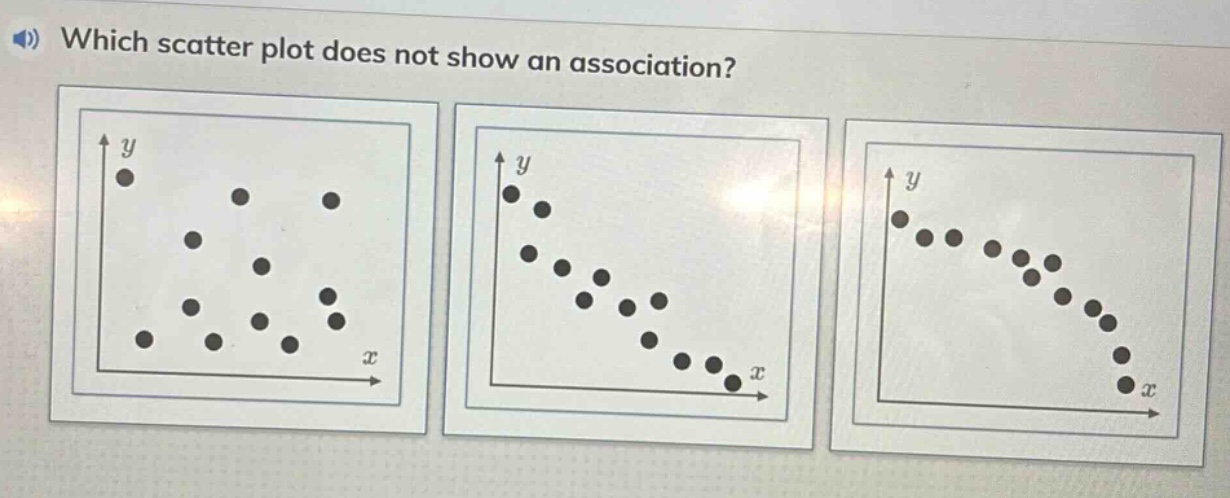
which scatter plot does not show an association?
Answer
Explanation:
Step1: Understand association in scatter - plots
An association exists when there is a pattern in the data points of a scatter - plot. A positive association has points that generally go up as we move from left to right, a negative association has points that generally go down as we move from left to right, and a non - linear association has a curved pattern.
Step2: Analyze each scatter - plot
In the first scatter - plot, the points are randomly scattered with no clear upward, downward, or curved pattern. In the second scatter - plot, the points show a negative linear association (as (x) increases, (y) decreases). In the third scatter - plot, the points show a non - linear (curved) association.
Answer:
The first scatter - plot