does this scatter plot show a positive trend, a negative trend, or no trend?
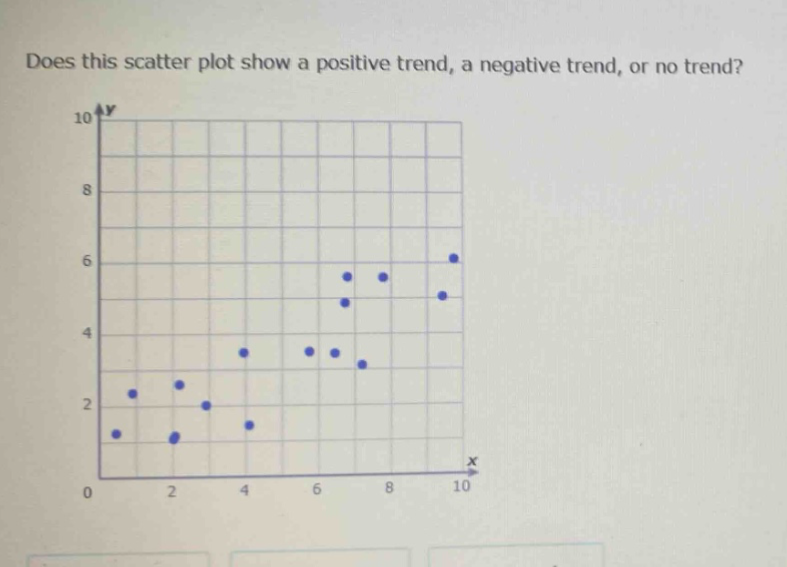
does this scatter plot show a positive trend, a negative trend, or no trend?
Answer
Answer:
Positive trend
Explanation:
Step1: Observe the scatter - plot
As the x - values increase, the y - values generally increase. For example, when x moves from 0 to 10, the corresponding y - values move from around 1 to around 6. So, there is a positive trend.