a scatter - plot is shown on the coordinate plane.\nwhich of the following graphs shows a line on the…
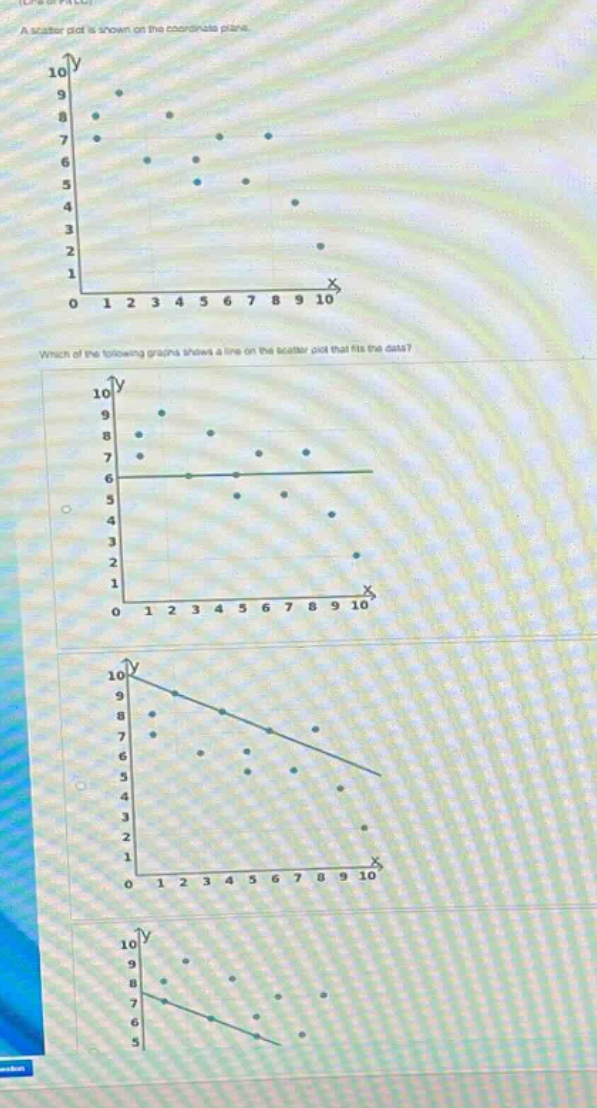
a scatter - plot is shown on the coordinate plane.\nwhich of the following graphs shows a line on the scatter - plot that fits the data?
Answer
Explanation:
Step1: Observe the trend of scatter - plot points
The points in the original scatter - plot seem to have a negative linear trend.
Step2: Analyze each option
The first option has a horizontal line which does not follow the trend of the points. The second option has a line with a negative slope that seems to pass through the general area of the points in the scatter - plot, following the negative trend. The third option has a line with a negative slope but does not seem to fit the data as well as the second option as it is not in the middle of the cluster of points.
Answer:
The second graph (the one with a line having a negative slope that passes through the general area of the scatter - plot points) shows a line that fits the data.