a scatter plot is shown on the coordinate plane. which two points would a line of fit go through to best fit…
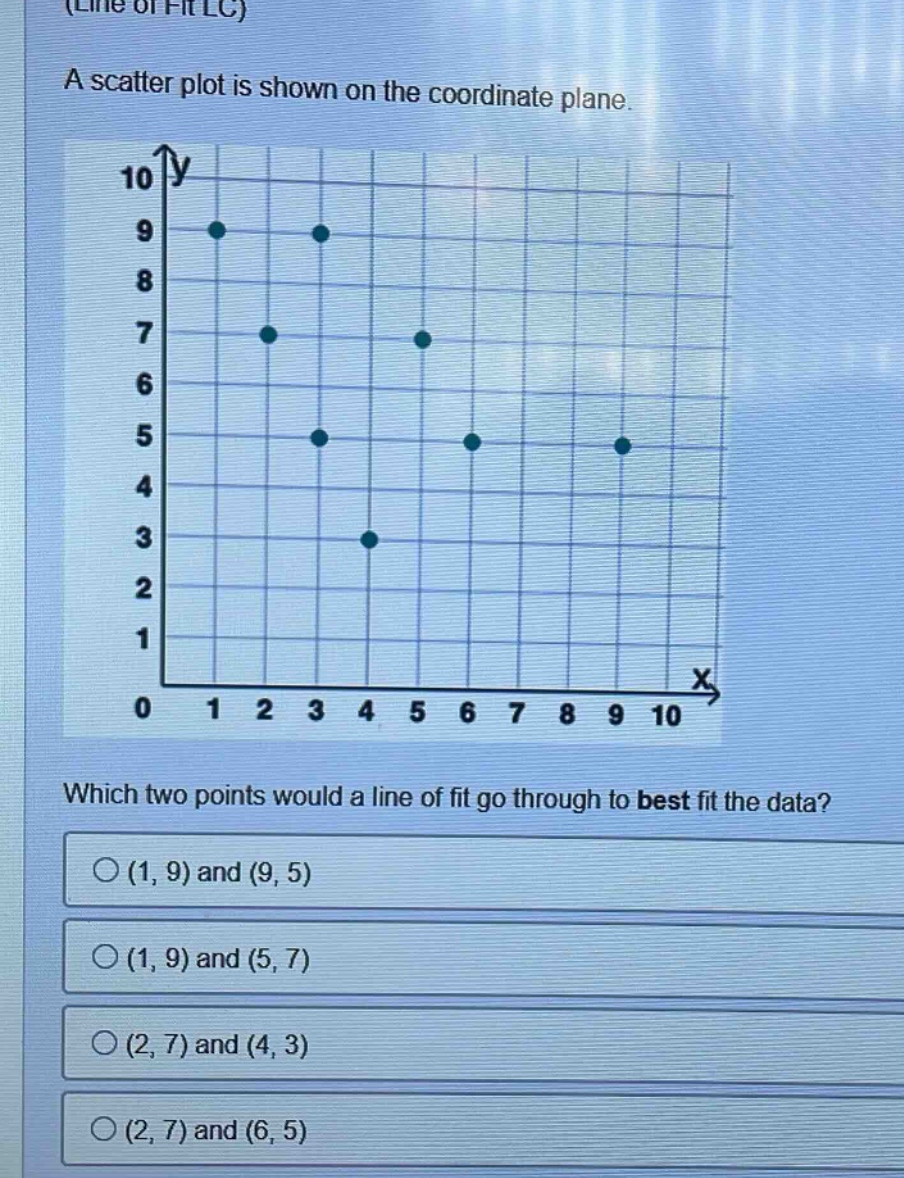
a scatter plot is shown on the coordinate plane. which two points would a line of fit go through to best fit the data? (1, 9) and (9, 5) (1, 9) and (5, 7) (2, 7) and (4, 3) (2, 7) and (6, 5)
Answer
Explanation:
Step1: Visual inspection
Visually assess the scatter - plot to find two points that represent the general trend of the data points.
Step2: Analyze options
For option A: (1, 9) and (9, 5) seem to capture the overall downward - sloping trend of the data well. The other options either do not pass through points that represent the central tendency of the data or are not in line with the general pattern of the scatter - plot.
Answer:
(1, 9) and (9, 5)