the scatter plot shown below represents the relationship between the high temperature, in degrees. based on…
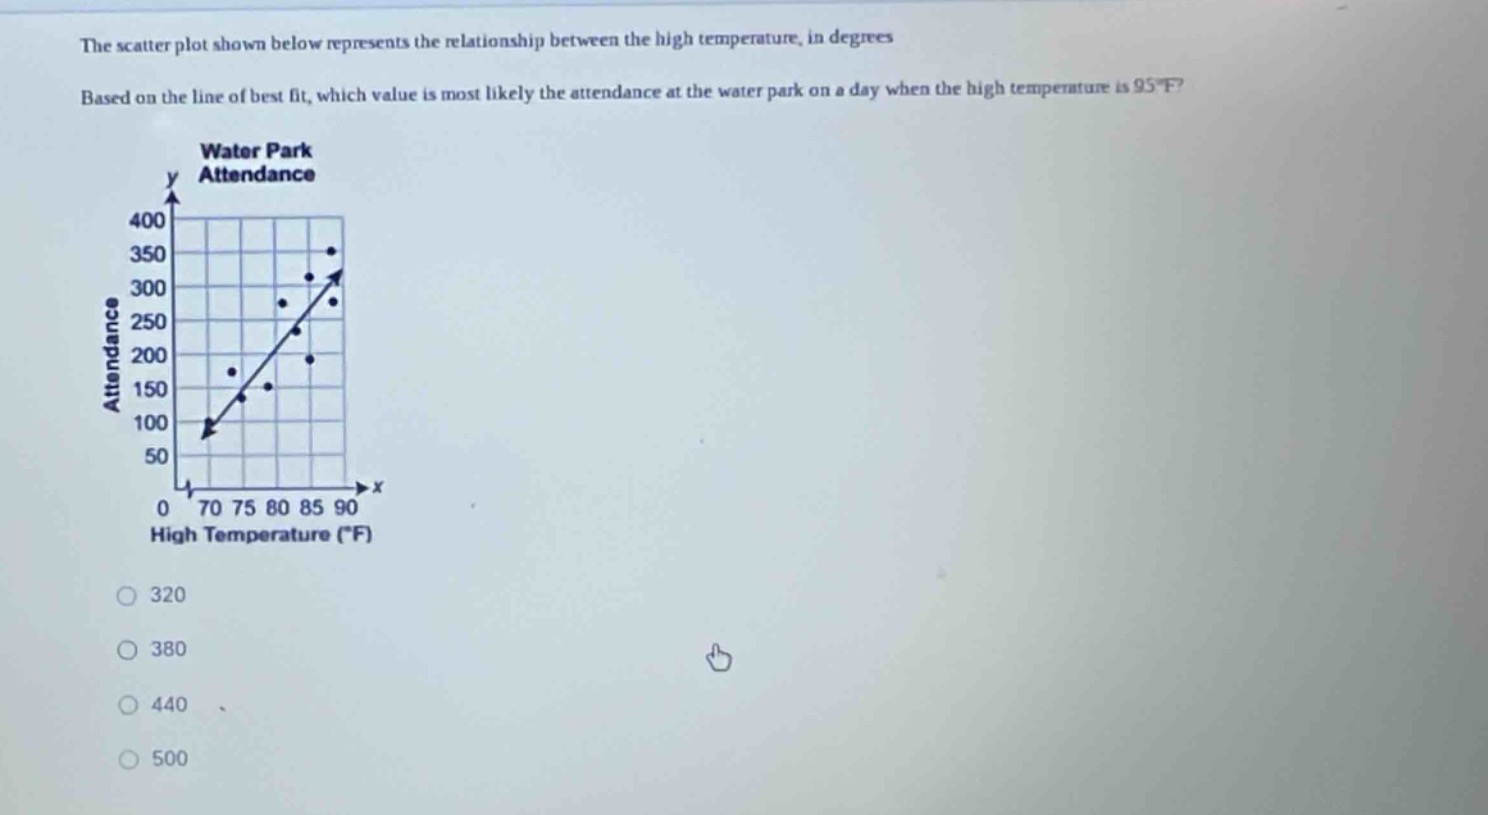
the scatter plot shown below represents the relationship between the high temperature, in degrees. based on the line of best fit, which value is most likely the attendance at the water park on a day when the high temperature is 95°f? water park attendance 400 350 300 250 200 150 100 50 0 70 75 80 85 90 high temperature (°f) 320 380 440 500
Answer
Explanation:
Step1: Locate 95 on x - axis
Find the value of 95 on the high - temperature (x) axis of the scatter - plot.
Step2: Follow up to line of best fit
Draw a vertical line up from 95 on the x - axis until it intersects the line of best fit.
Step3: Read y - value
From the intersection point with the line of best fit, draw a horizontal line to the y - axis