which scatter plot shows an association?
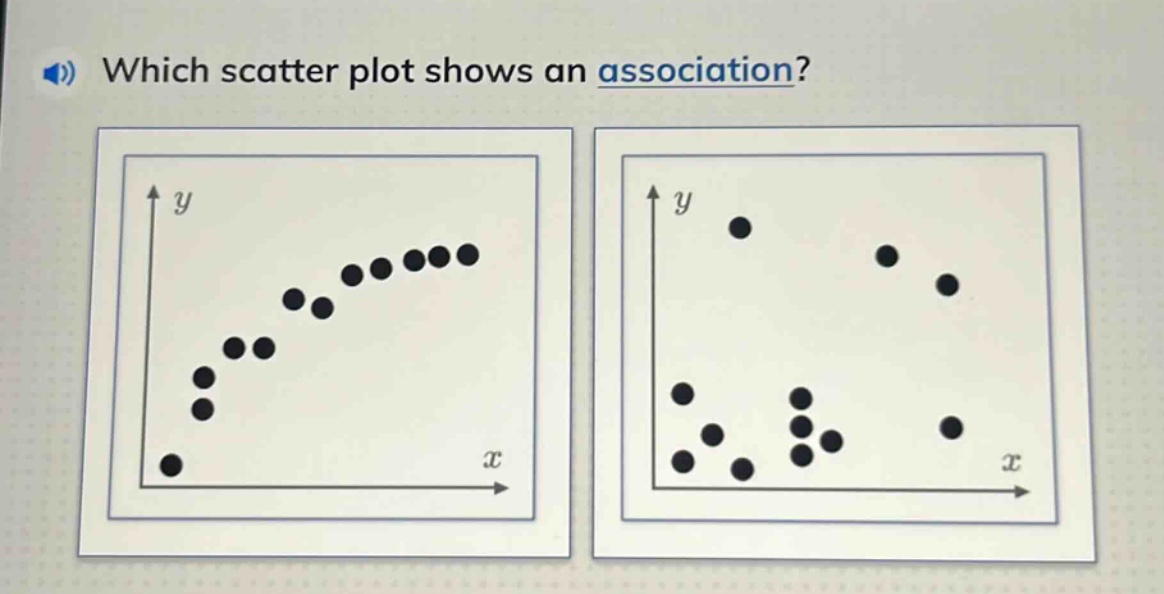
which scatter plot shows an association?
Answer
Explanation:
Step 1: Understand association in scatter plots
An association exists if data points show a pattern (linear, nonlinear). Randomly scattered points show no association.
Step 2: Analyze first scatter plot
Points form a curved pattern, indicating a nonlinear association.
Step 3: Analyze second scatter plot
Points are randomly distributed with no discernible pattern, showing no association.
Answer:
The first scatter plot shows an association.