this scatter plot shows the association between time elapsed and distance left to go when john drove from…
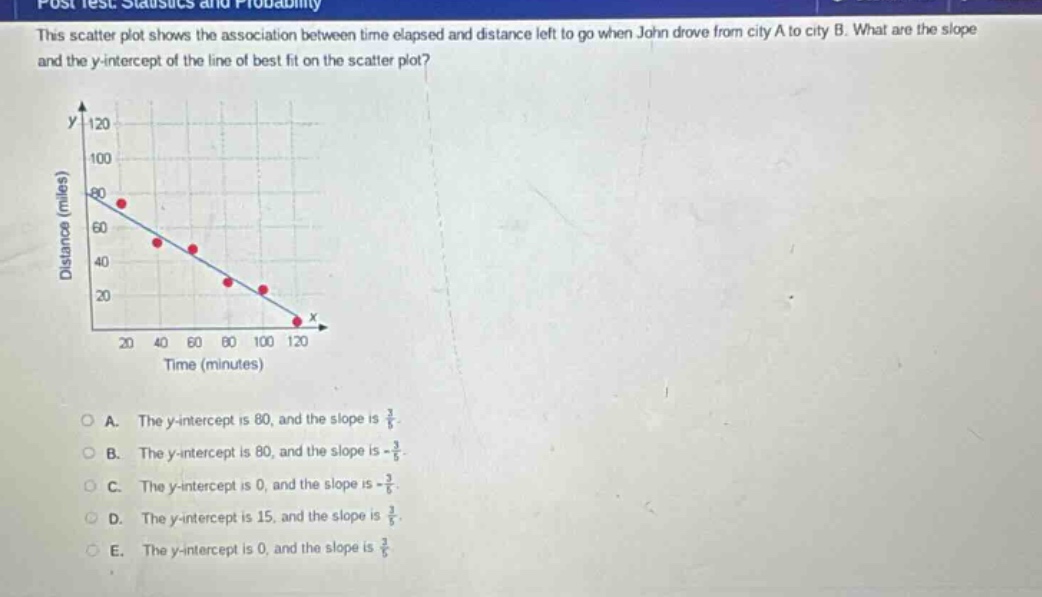
this scatter plot shows the association between time elapsed and distance left to go when john drove from city a to city b. what are the slope and the y - intercept of the line of best fit on the scatter plot?\na. the y - intercept is 80, and the slope is $\frac{3}{5}$.\nb. the y - intercept is 80, and the slope is - $\frac{3}{5}$.\nc. the y - intercept is 0, and the slope is - $\frac{3}{5}$.\nd. the y - intercept is 15, and the slope is $\frac{3}{5}$.\ne. the y - intercept is 0, and the slope is $\frac{3}{5}$.
Answer
Explanation:
Step1: Identify y - intercept
The y - intercept is the value of y when x = 0. From the scatter - plot, when x (time) = 0, y (distance) = 80.
Step2: Calculate the slope
The slope formula is $m=\frac{y_2 - y_1}{x_2 - x_1}$. Let's take two points on the line of best - fit, say (0, 80) and (100, 20). Then $m=\frac{20 - 80}{100-0}=\frac{- 60}{100}=-\frac{3}{5}$.
Answer:
B. The y - intercept is 80, and the slope is $-\frac{3}{5}$.