the scatter plot shows the daily high temperatures for 5 days. complete the sentence. the data suggest that…
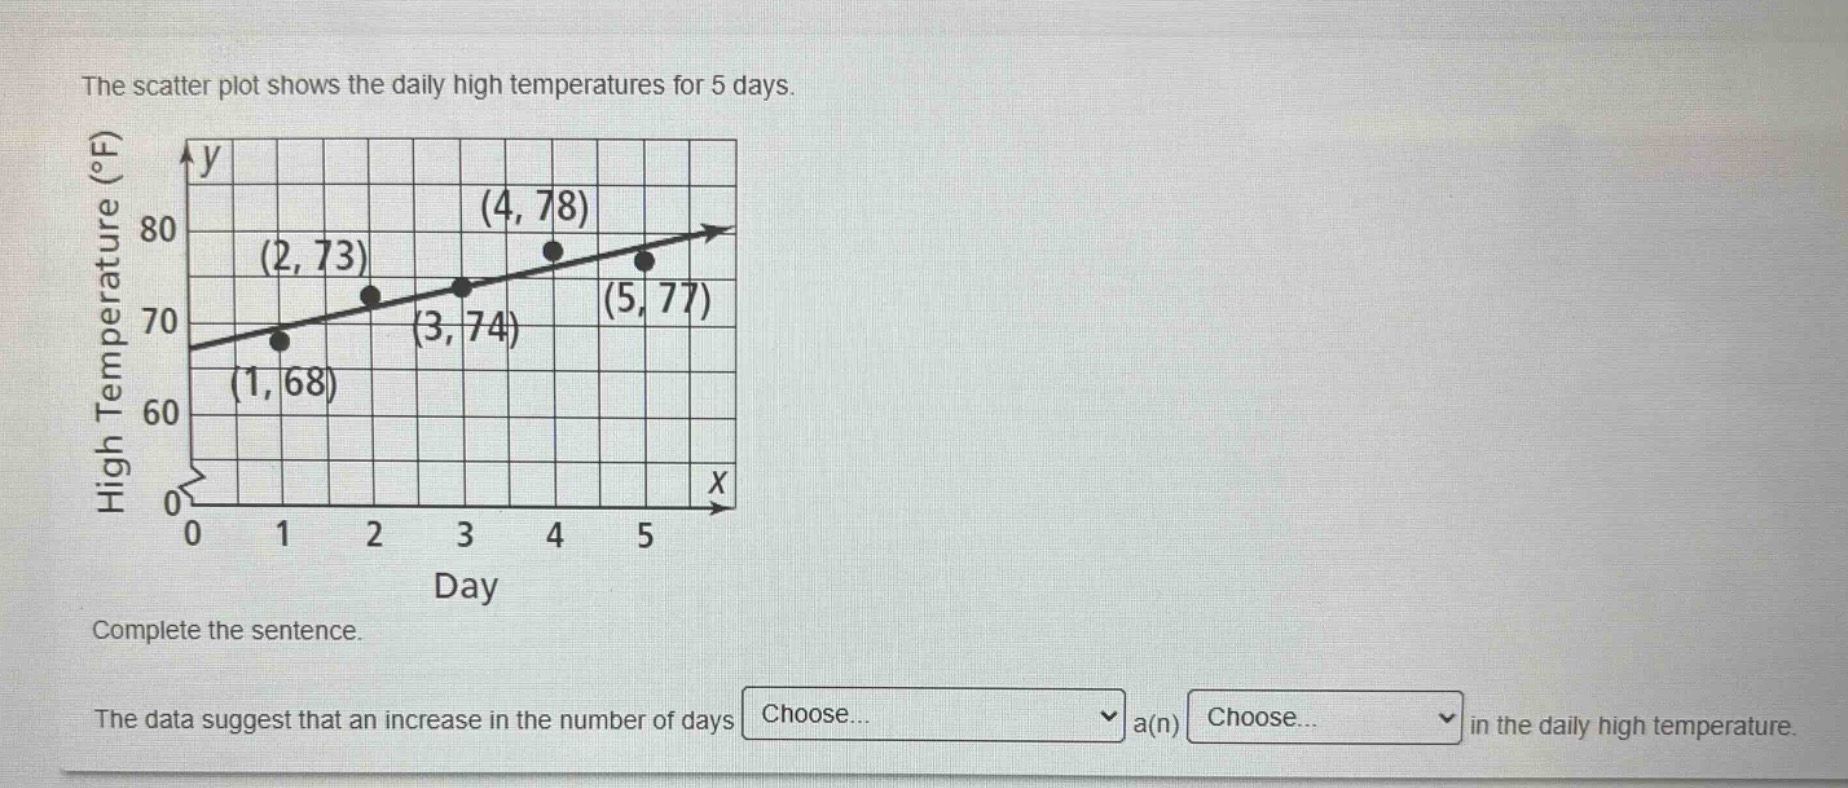
the scatter plot shows the daily high temperatures for 5 days. complete the sentence. the data suggest that an increase in the number of days choose... a(n) choose... in the daily high temperature.
Answer
Explanation:
Step1: Observe the scatter - plot
As the value of (x) (number of days) increases from (1) to (5), the value of (y) (high temperature) generally increases from (68^{\circ}F) to (77^{\circ}F).
Step2: Determine the relationship
The data shows a positive - correlation between the number of days and the daily high temperature.
Answer:
The data suggest that an increase in the number of days is associated with a(n) increase in the daily high temperature.