which scatter plot shows a linear association?
which scatter plot shows a linear association?
Answer
Answer:
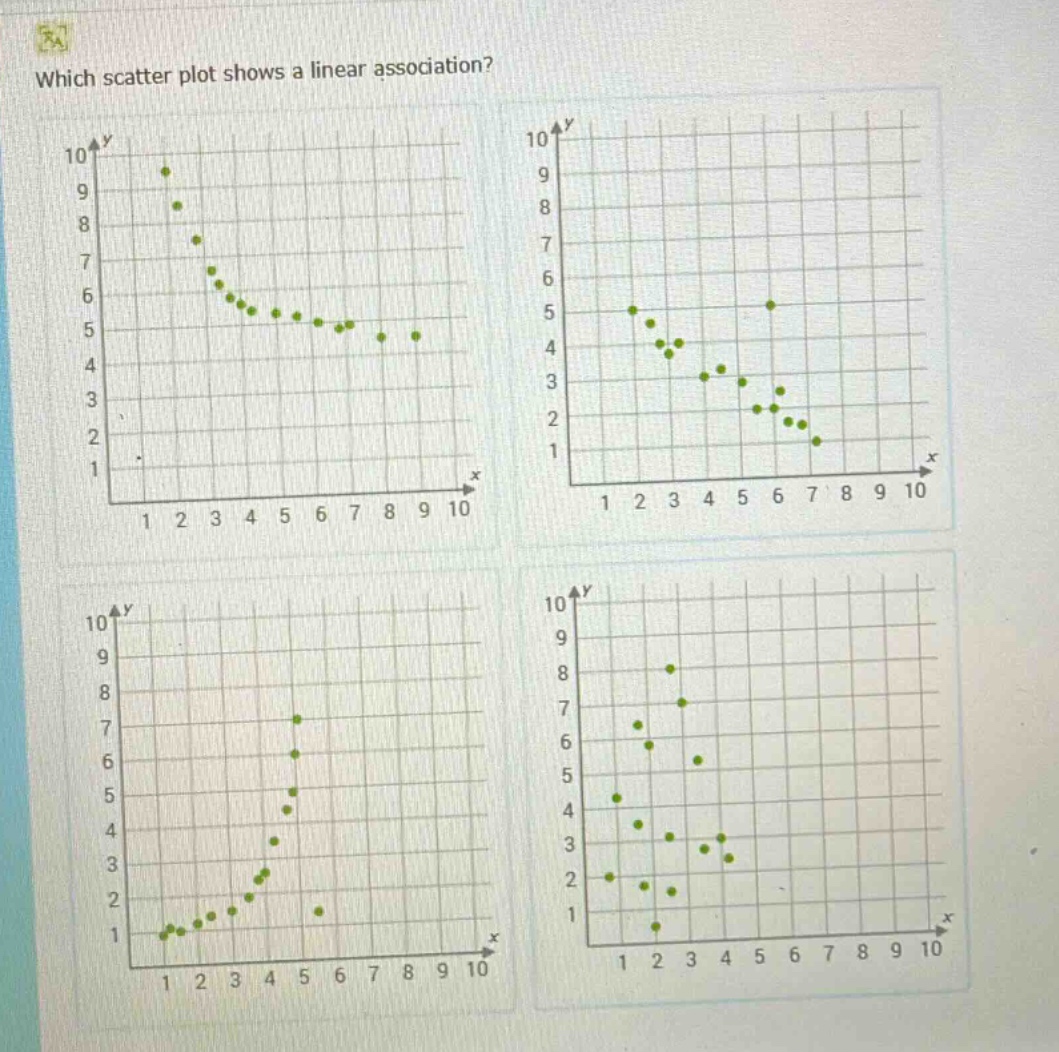
The scatter - plot in the bottom - left shows a linear association.
Explanation:
Step1: Understand linear association
Points should form a line - like pattern.
Step2: Analyze top - left plot
Points form a curve, not linear.
Step3: Analyze top - right plot
Points are scattered without a clear line pattern.
Step4: Analyze bottom - left plot
Points roughly form a straight - line pattern.
Step5: Analyze bottom - right plot
Points are randomly scattered, no linear pattern.