which scatter plot shows a linear association with no outliers?
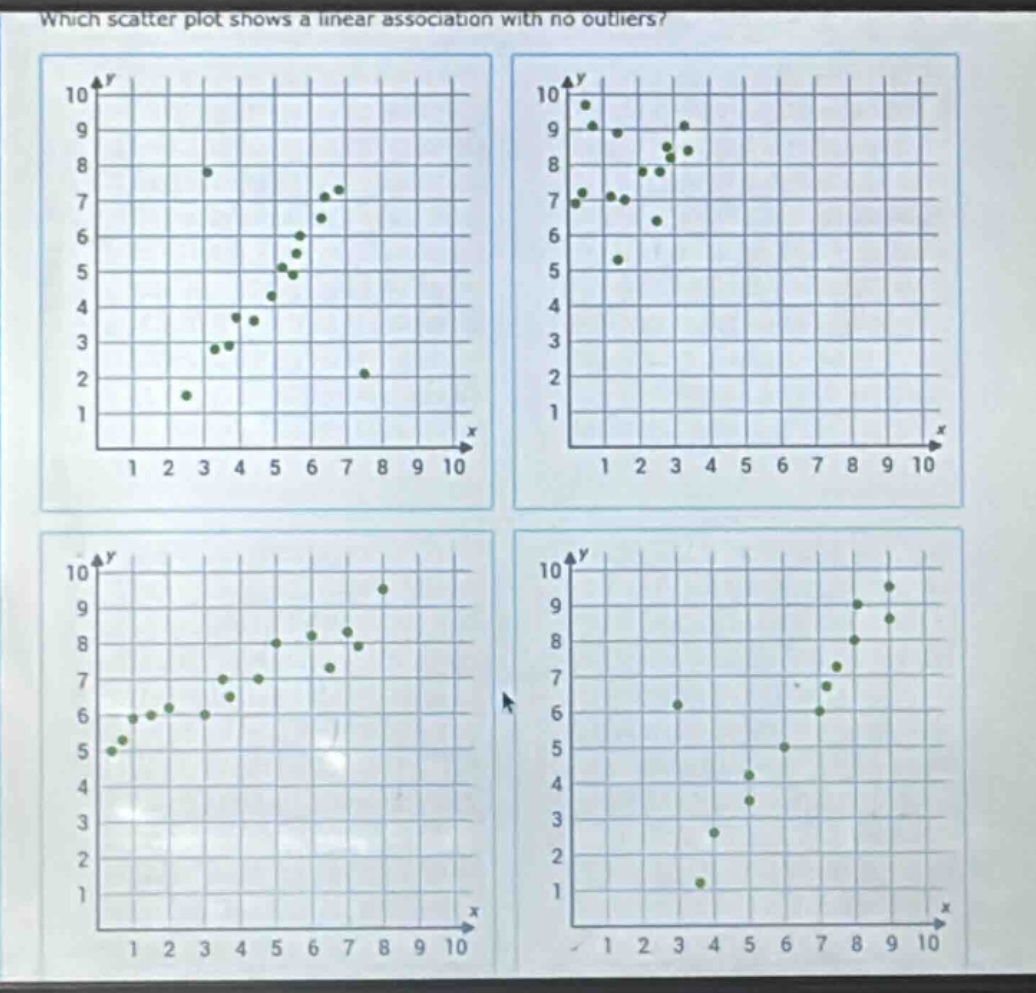
which scatter plot shows a linear association with no outliers?
Answer
Explanation:
Step1: Recall linear - association and outlier concepts
A linear association means the points in a scatter - plot tend to follow a straight - line pattern. An outlier is a data point that is far away from the other data points.
Step2: Analyze the first scatter - plot
The first scatter - plot has a point that is far away from the general linear pattern of the other points, so it has an outlier.
Step3: Analyze the second scatter - plot
The points in the second scatter - plot do not follow a clear linear pattern.
Step4: Analyze the third scatter - plot
The points in the third scatter - plot follow a relatively straight - line pattern and there are no points that are far away from the rest of the points.
Step5: Analyze the fourth scatter - plot
The fourth scatter - plot has some points that deviate from the general linear trend and can be considered outliers.
Answer:
The third scatter - plot (bottom - left in the given image) shows a linear association with no outliers.