which scatter plot shows a negative linear association in the data?
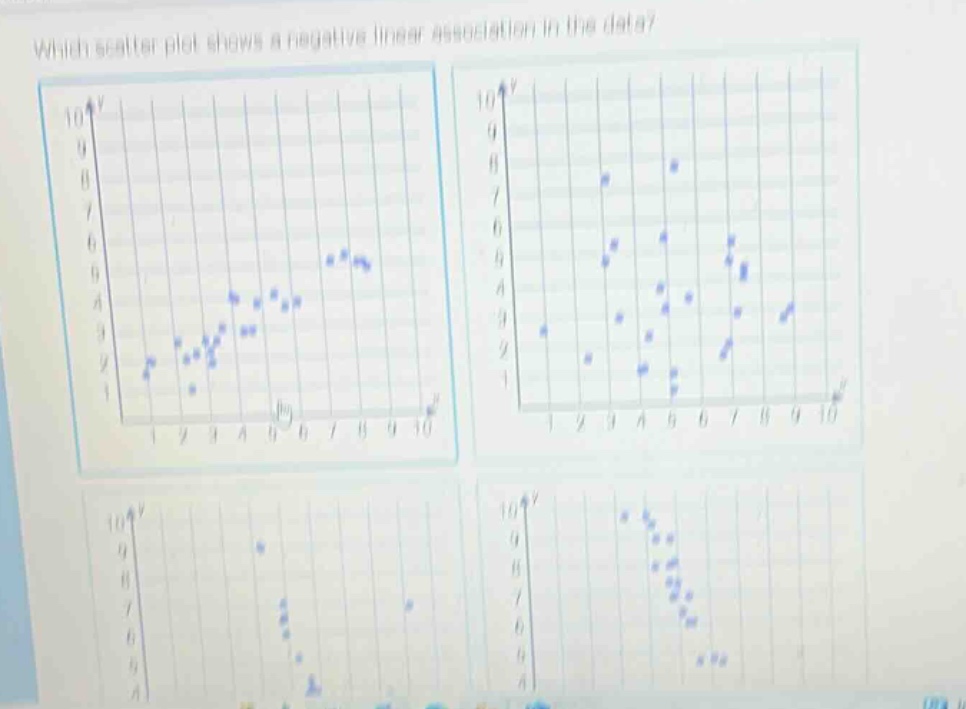
which scatter plot shows a negative linear association in the data?
Answer
Explanation:
Step1: Recall negative linear association
In a negative - linear association, as the x - values increase, the y - values tend to decrease in a somewhat linear fashion.
Step2: Examine each scatter - plot
In the first scatter - plot, as x increases, y generally increases (positive association). In the second scatter - plot, there is no clear linear pattern. In the third scatter - plot, there is no clear linear pattern. In the fourth scatter - plot, as x increases, y decreases in a somewhat linear way.
Answer:
The fourth scatter - plot.