which scatter plot shows a non - linear association between the variables?
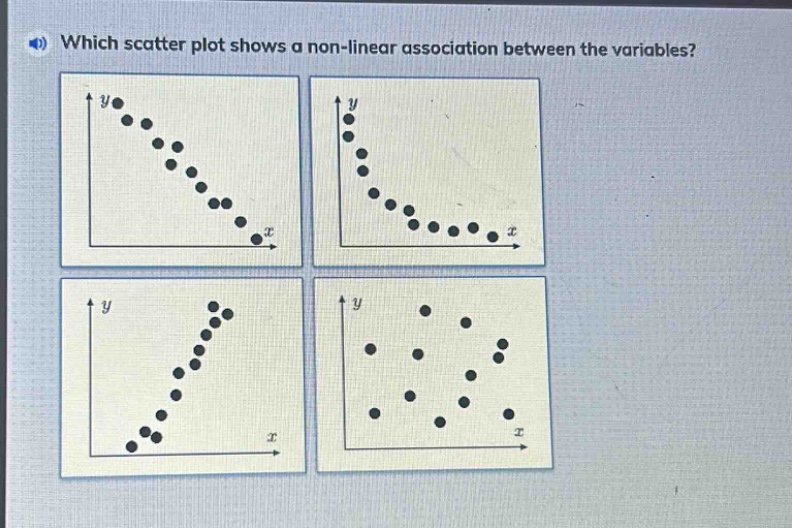
which scatter plot shows a non - linear association between the variables?
Answer
Explanation:
Step1: Understand linear and non - linear association
In a linear association, the data points can be approximated by a straight line. In a non - linear association, they cannot.
Step2: Analyze each scatter - plot
The first scatter - plot shows points that can be approximated by a straight line (negative slope), so it has a linear association. The third scatter - plot shows points that can be approximated by a straight line (positive slope), so it has a linear association. The fourth scatter - plot shows no clear pattern (random), not a non - linear association. The second scatter - plot shows a curve - like pattern of points that cannot be approximated by a straight line.
Answer:
The second scatter - plot (top right) shows a non - linear association between the variables.