which scatter plot shows a nonlinear association?
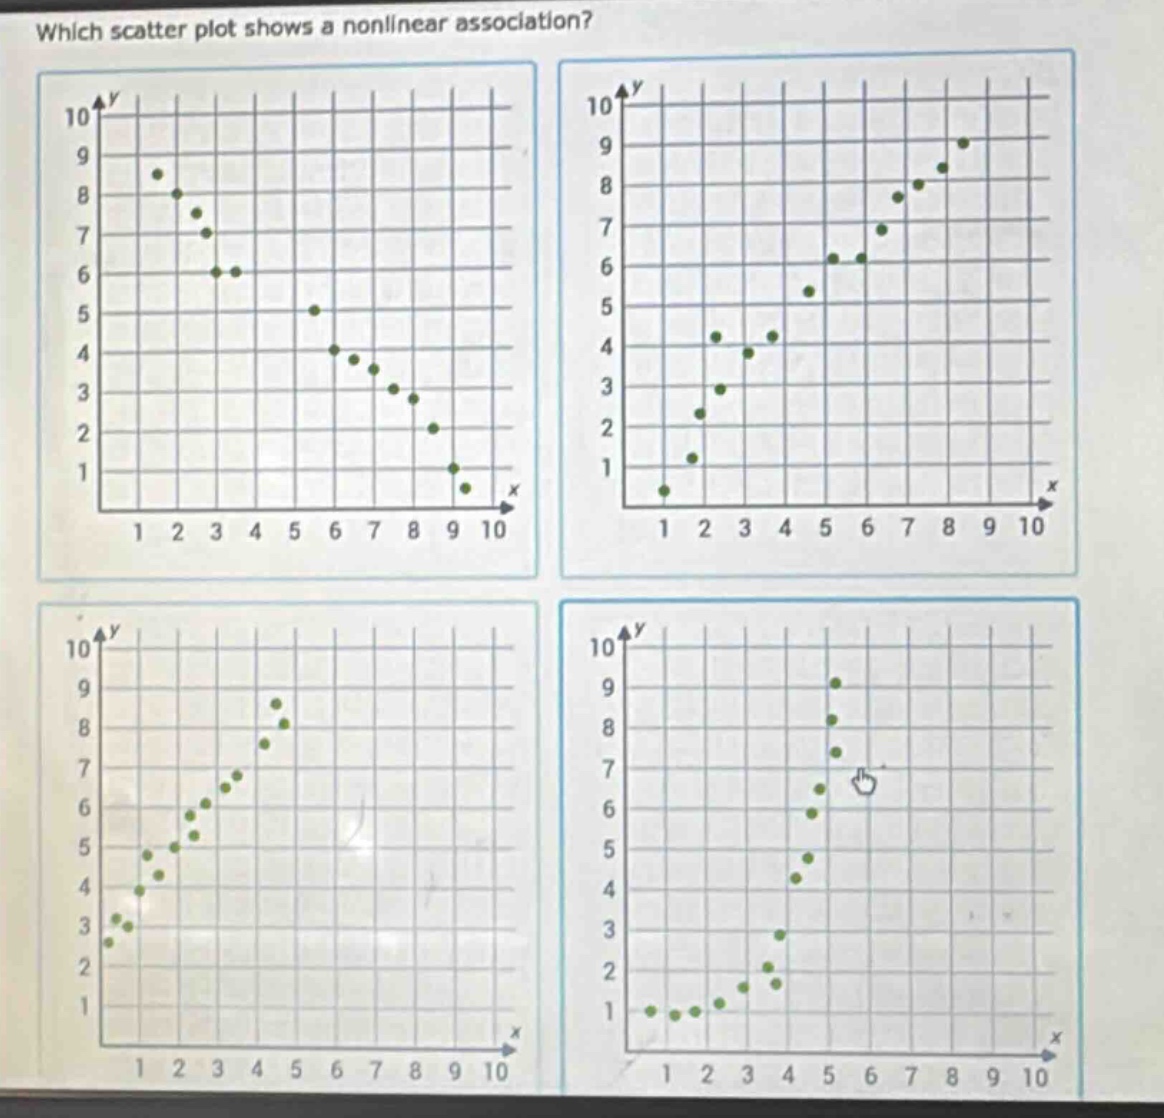
which scatter plot shows a nonlinear association?
Answer
Brief Explanations:
In a nonlinear association, the points on a scatter - plot do not follow a straight - line pattern. In the first scatter - plot, the points do not form a straight line but rather a curved pattern. The second and third scatter - plots show points that can be approximated by a straight line (linear association). The fourth scatter - plot also has a somewhat linear trend.
Answer:
The first scatter - plot (top - left) shows a nonlinear association.