which scatter plot shows a nonlinear association for the data?
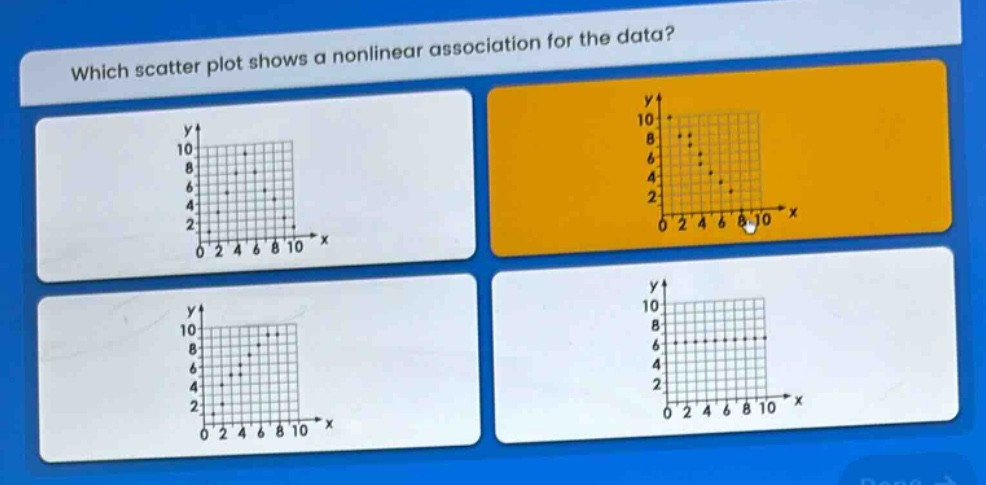
which scatter plot shows a nonlinear association for the data?
Answer
Explanation:
Step1: Understand linear and nonlinear association
In a linear association, data points roughly form a straight - line pattern. In a nonlinear association, the data points do not form a straight - line pattern.
Step2: Analyze each scatter - plot
For the first scatter - plot, the points seem to be randomly scattered with no clear pattern (neither linear nor nonlinear). For the second scatter - plot, the points follow a curved pattern, which indicates a nonlinear association. For the third scatter - plot, the points roughly form a straight - line pattern, indicating a linear association. For the fourth scatter - plot, the points form a horizontal line (a special case of a linear relationship).
Answer:
The second scatter - plot (the one in the orange box) shows a nonlinear association for the data.