the scatter plot shows the number of cars and trucks sold by 10 different employees at a car and truck…
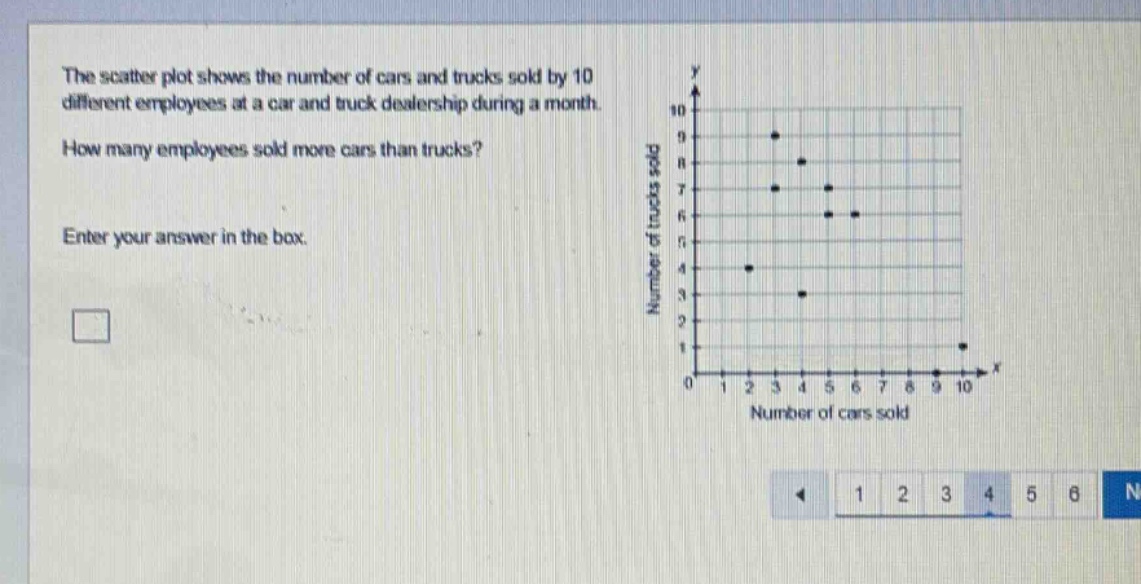
the scatter plot shows the number of cars and trucks sold by 10 different employees at a car and truck dealership during a month. how many employees sold more cars than trucks? enter your answer in the box.
Answer
Explanation:
Step1: Analyze scatter - plot points
For each point (x, y) on the scatter - plot, x represents the number of cars sold and y represents the number of trucks sold. We need to find the points where x>y.
Step2: Count the points
By observing the scatter - plot:
- For the point (3,4), 3<4 (not valid).
- For the point (4,9), 4<9 (not valid).
- For the point (5,8), 5<8 (not valid).
- For the point (5,7), 5<7 (not valid).
- For the point (6,6), 6 = 6 (not valid).
- For the point (6,8), 6<8 (not valid).
- For the point (3,3), 3 = 3 (not valid).
- For the point (9,1), 9>1 (valid).
- For the point (10,1), 10>1 (valid).
- For the point (4,3), 4>3 (valid).
The valid points are (4,3), (9,1), (10,1). So there are 3 points where the number of cars sold is more than the number of trucks sold.
Answer:
3