the scatter plot shows the number of people visiting a walking track on 15 different days and the…
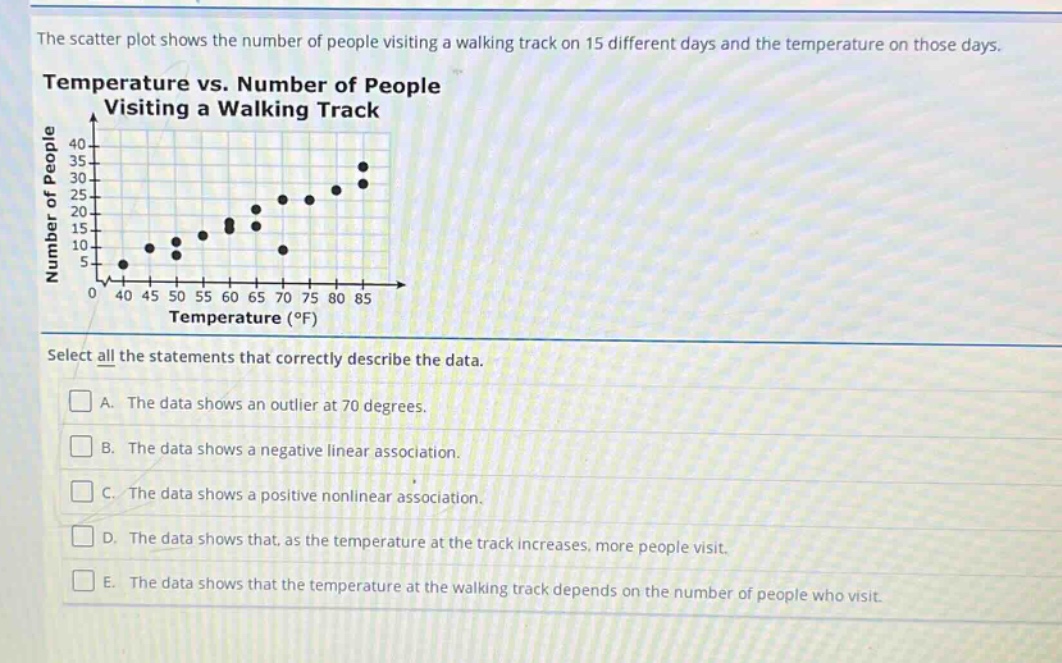
the scatter plot shows the number of people visiting a walking track on 15 different days and the temperature on those days. temperature vs. number of people visiting a walking track select all the statements that correctly describe the data. a. the data shows an outlier at 70 degrees. b. the data shows a negative linear association. c. the data shows a positive nonlinear association. d. the data shows that, as the temperature at the track increases, more people visit. e. the data shows that the temperature at the walking track depends on the number of people who visit.
Answer
Explanation:
Step1: Analyze outlier
At 70 degrees, the data - point is in line with the general pattern of other points, so there is no outlier at 70 degrees.
Step2: Analyze linear - association
As the temperature increases, the number of people generally increases, but not in a straight - line (linear) fashion. So, it is not a negative linear association.
Step3: Analyze association type
The number of people increases as the temperature increases, and the relationship is not linear. So, it is a positive non - linear association.
Step4: Analyze temperature - people relationship
From the scatter - plot, as the temperature at the track increases, more people visit.
Step5: Analyze cause - effect relationship
The number of people visiting the track depends on the temperature, not the other way around. The temperature is an independent variable here.
Answer:
C. The data shows a positive nonlinear association.; D. The data shows that, as the temperature at the track increases, more people visit.