the scatter plot below shows the number of pizzas sold during weeks when different numbers of coupons were…
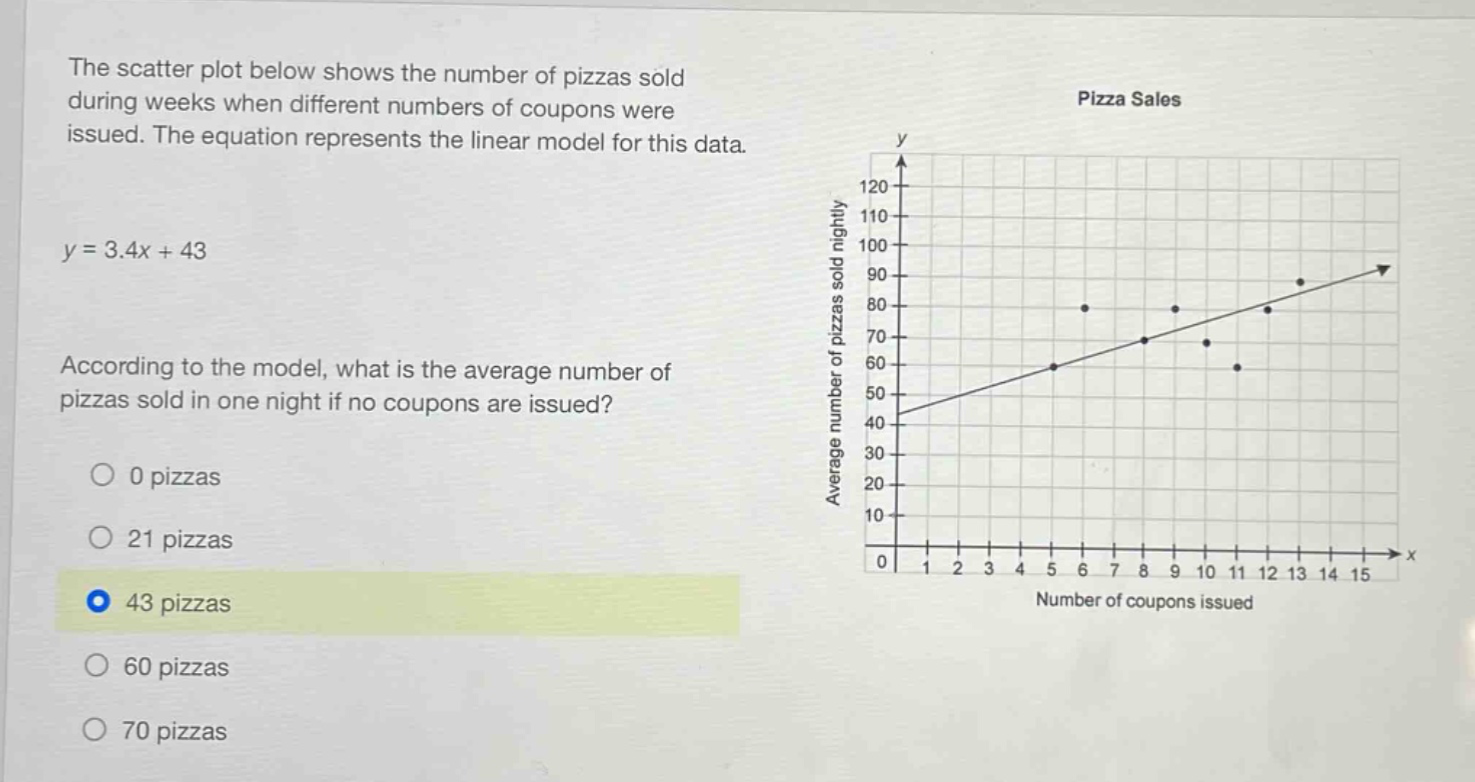
the scatter plot below shows the number of pizzas sold during weeks when different numbers of coupons were issued. the equation represents the linear model for this data. y = 3.4x + 43 according to the model, what is the average number of pizzas sold in one night if no coupons are issued? 0 pizzas 21 pizzas 43 pizzas 60 pizzas 70 pizzas
Answer
Explanation:
Step1: Identify the variable
The number of coupons issued is $x$. When no coupons are issued, $x = 0$.
Step2: Substitute into the equation
Substitute $x = 0$ into $y=3.4x + 43$. We get $y=3.4\times0 + 43$.
Step3: Calculate the result
$3.4\times0=0$, so $y = 0 + 43=43$.
Answer:
43 pizzas