the scatter plot shows the number of text messages that each member of a study group sent and received…
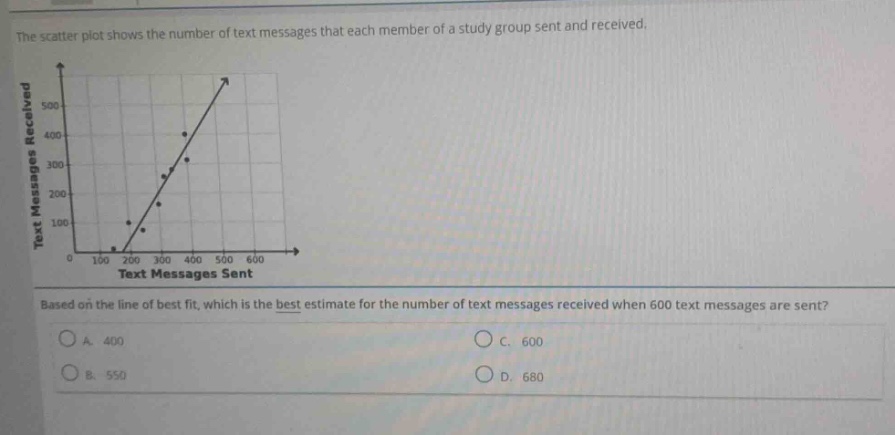
the scatter plot shows the number of text messages that each member of a study group sent and received. based on the line of best fit, which is the best estimate for the number of text messages received when 600 text messages are sent? a. 400 b. 550 c. 600 d. 680
Answer
Explanation:
Step1: Locate 600 on x - axis
Find 600 on the "Text Messages Sent" (x - axis).
Step2: Read corresponding y - value
Move vertically up from 600 on x - axis until reaching the line of best fit, then move horizontally to the y - axis to read the value. From the scatter - plot, when x = 600, the y - value (number of text messages received) is approximately 600.
Answer:
C. 600