8. the scatter plot shows the relationship between the age and length of loggerhead turtles. which trend…
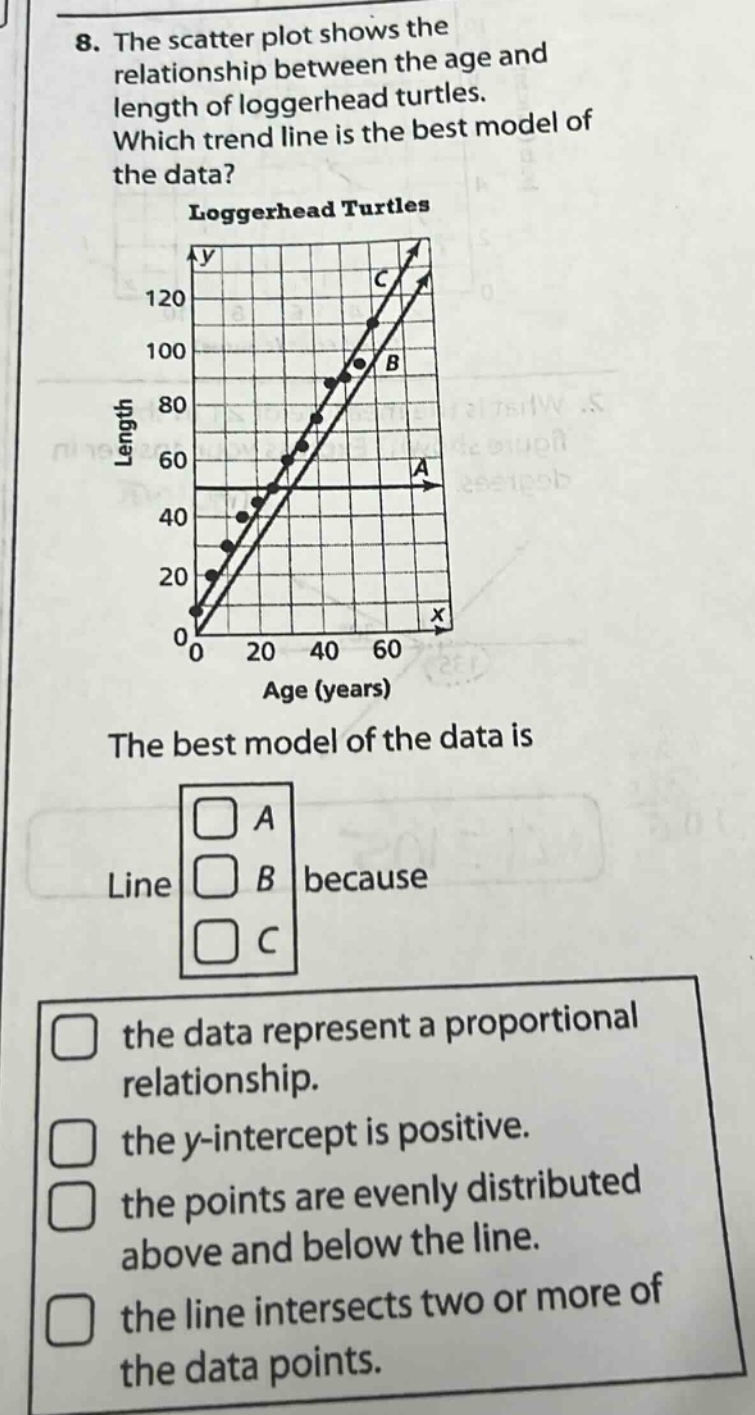
8. the scatter plot shows the relationship between the age and length of loggerhead turtles. which trend line is the best model of the data? loggerhead turtles the best model of the data is line a b c because the data represent a proportional relationship. the y - intercept is positive. the points are evenly distributed above and below the line. the line intersects two or more of the data points.
Answer
Explanation:
Step1: Understand trend - line concept
A good trend - line for a scatter plot should have data points evenly distributed above and below it.
Step2: Analyze each line
Line A is a horizontal line and does not follow the upward trend of the data. Line C seems to be above most of the data points. Line B has data points evenly distributed above and below it.
Answer:
Line B; the points are evenly distributed above and below the line.