the scatter plot shows the relationship between age in years and time spent playing outside in minutes for…
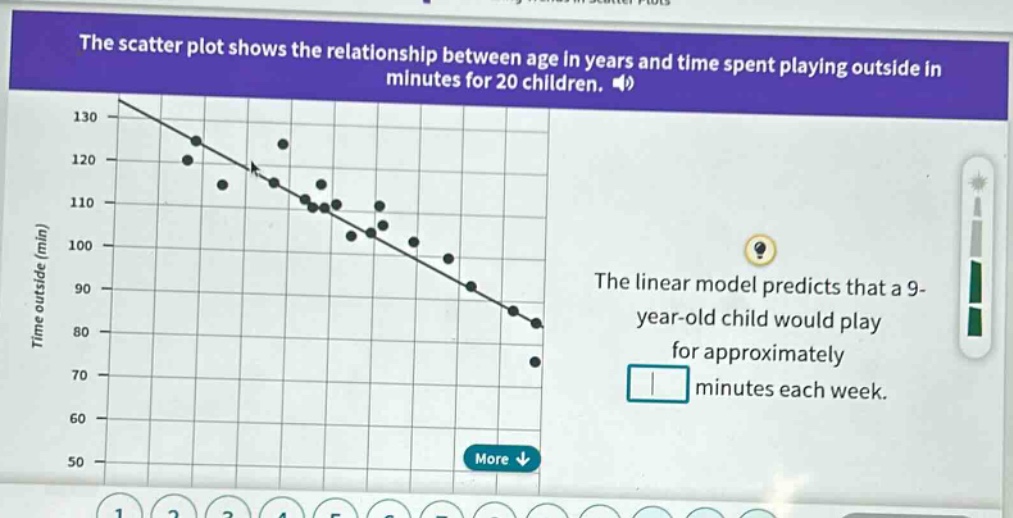
the scatter plot shows the relationship between age in years and time spent playing outside in minutes for 20 children. the linear model predicts that a 9 - year - old child would play for approximately minutes each week.
Answer
Explanation:
Step1: Locate the age on the x-axis
Find the value corresponding to 9 years on the horizontal axis, which represents age.
Step2: Find the point on the linear model
Move vertically from the age of 9 on the x-axis up to the line representing the linear model.
Step3: Read the corresponding time on the y-axis
Move horizontally from the point on the line to the vertical axis, which represents time outside in minutes. Read the value on the y-axis. The value on the y-axis corresponding to an age of 9 years on the linear model is approximately 80 minutes.
Answer:
80