the scatter plot shows the relationship between the height, h, in centimeters of a stack of sandwich cookies…
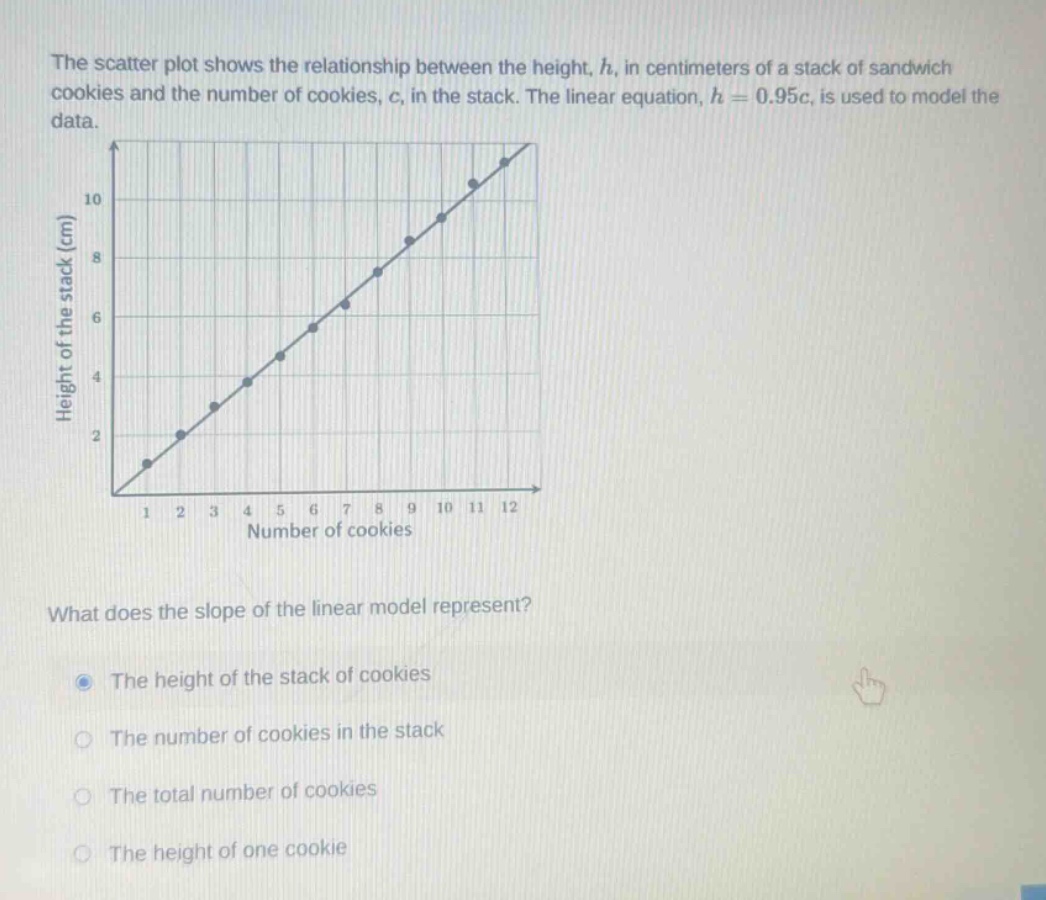
the scatter plot shows the relationship between the height, h, in centimeters of a stack of sandwich cookies and the number of cookies, c, in the stack. the linear equation, h = 0.95c, is used to model the data. what does the slope of the linear model represent? the height of the stack of cookies the number of cookies in the stack the total number of cookies the height of one cookie
Answer
Brief Explanations:
In a linear equation of the form $y = mx + b$ (here $h = 0.95c+0$), the slope $m$ represents the change in $y$ (height $h$) for a unit - change in $x$ (number of cookies $c$). So, the slope 0.95 represents the increase in height for each additional cookie, which is the height of one cookie.
Answer:
The height of one cookie