the scatter plot shows the relationship between the number of pieces in a jigsaw puzzle and the number of…
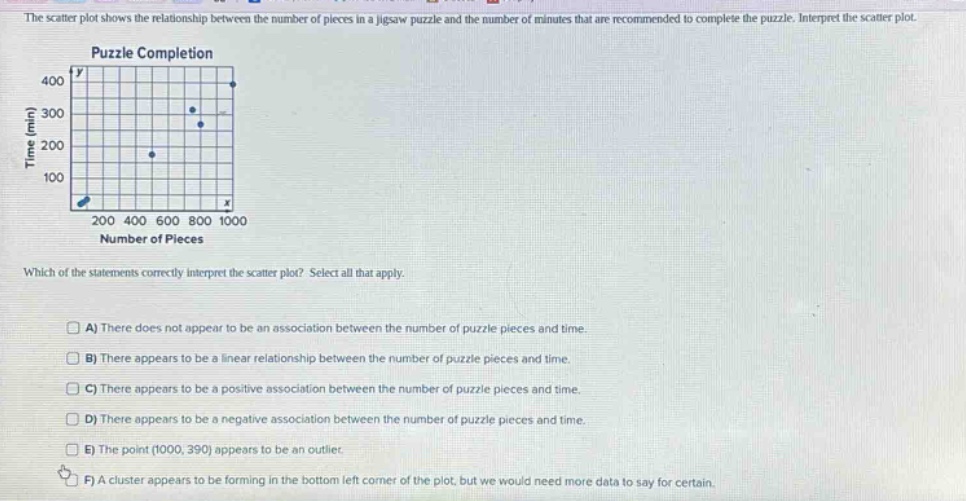
the scatter plot shows the relationship between the number of pieces in a jigsaw puzzle and the number of minutes that are recommended to complete the puzzle. interpret the scatter plot.\npuzzle completion\nwhich of the statements correctly interpret the scatter plot? select all that apply.\na) there does not appear to be an association between the number of puzzle pieces and time.\nb) there appears to be a linear relationship between the number of puzzle pieces and time.\nc) there appears to be a positive association between the number of puzzle pieces and time.\nd) there appears to be a negative association between the number of puzzle pieces and time.\ne) the point (1000, 390) appears to be an outlier.\nf) a cluster appears to be forming in the bottom left corner of the plot, but we would need more data to say for certain.
Answer
Explanation:
Step 1: Observe the scatter plot trend
As the number of puzzle pieces increases, the recommended time generally increases, indicating a positive trend.
Step 2: Evaluate linearity
Points roughly form an upward trend without obvious curving, suggesting a potential linear relationship.
Step 3: Check for outliers/clusters
The point (1000, 390) follows the general trend, so it is not an outlier. Only a few scattered points exist without a clear cluster in the bottom left.
Answer:
B. There appears to be a linear relationship between the number of puzzle pieces and time., C. There appears to be a positive association between the number of puzzle pieces and time.