the scatter plot shows the relationship between the number of years a swimmer is on the swim team and the…
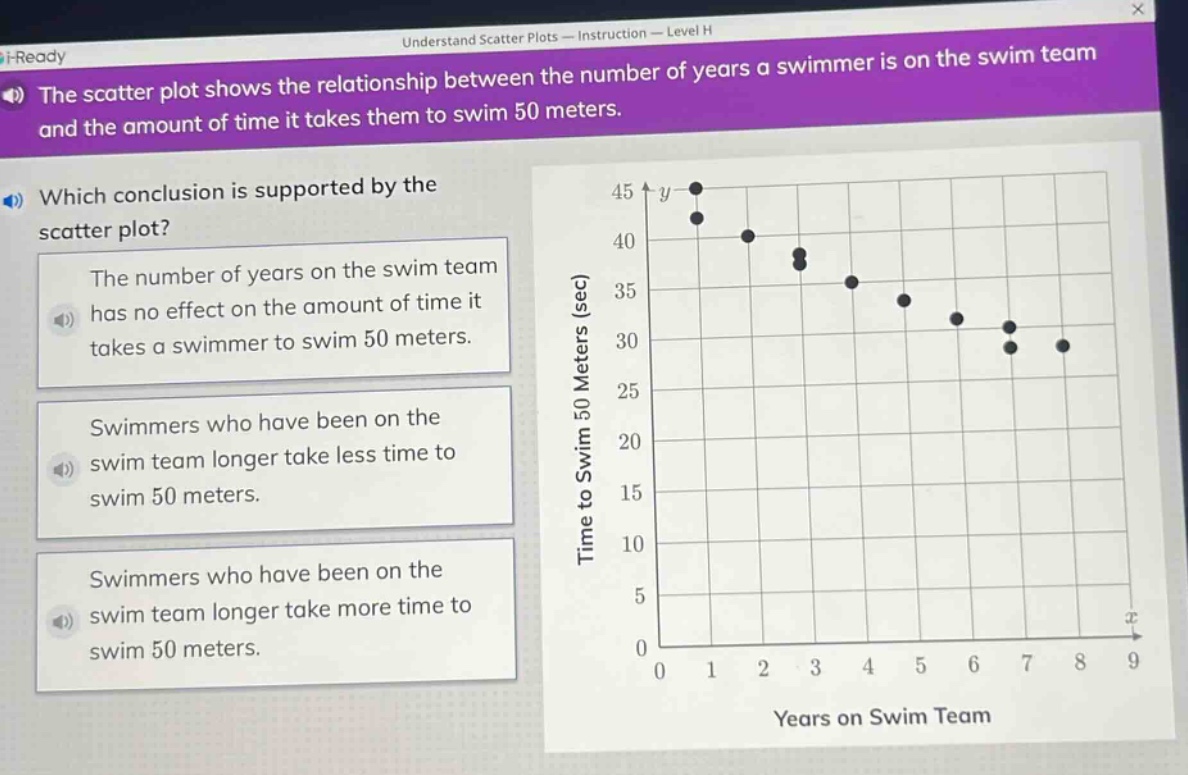
the scatter plot shows the relationship between the number of years a swimmer is on the swim team and the amount of time it takes them to swim 50 meters. which conclusion is supported by the scatter plot? the number of years on the swim team has no effect on the amount of time it takes a swimmer to swim 50 meters. swimmers who have been on the swim team longer take less time to swim 50 meters. swimmers who have been on the swim team longer take more time to swim 50 meters.
Answer
Explanation:
Step1: Observe scatter plot trend
As years on team (x-axis) increase, time to swim (y-axis) decreases.
Step2: Analyze correlation direction
Negative correlation: longer team membership associates with faster swimming.
Answer:
Swimmers who have been on the swim team longer take less time to swim 50 meters.