the scatter plot shows the relationship between tickets sales at a theme park and the number of cloudy days…
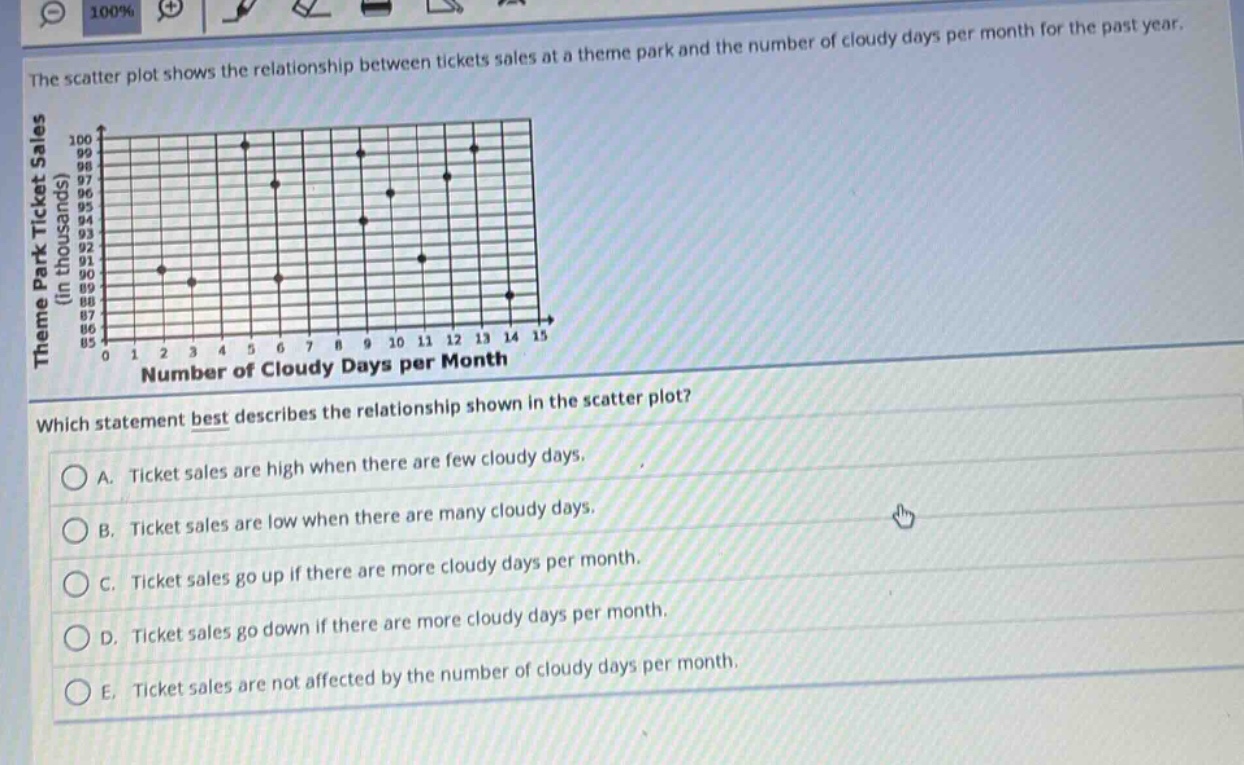
the scatter plot shows the relationship between tickets sales at a theme park and the number of cloudy days per month for the past year. which statement best describes the relationship shown in the scatter plot? a. ticket sales are high when there are few cloudy days. b. ticket sales are low when there are many cloudy days. c. ticket sales go up if there are more cloudy days per month. d. ticket sales go down if there are more cloudy days per month. e. ticket sales are not affected by the number of cloudy days per month.
Answer
Brief Explanations:
By observing the scatter - plot, as the number of cloudy days per month increases, the theme park ticket sales also increase.
Answer:
C. Ticket sales go up if there are more cloudy days per month.