the scatter plot below shows the relationship between years of education and income for a representative…
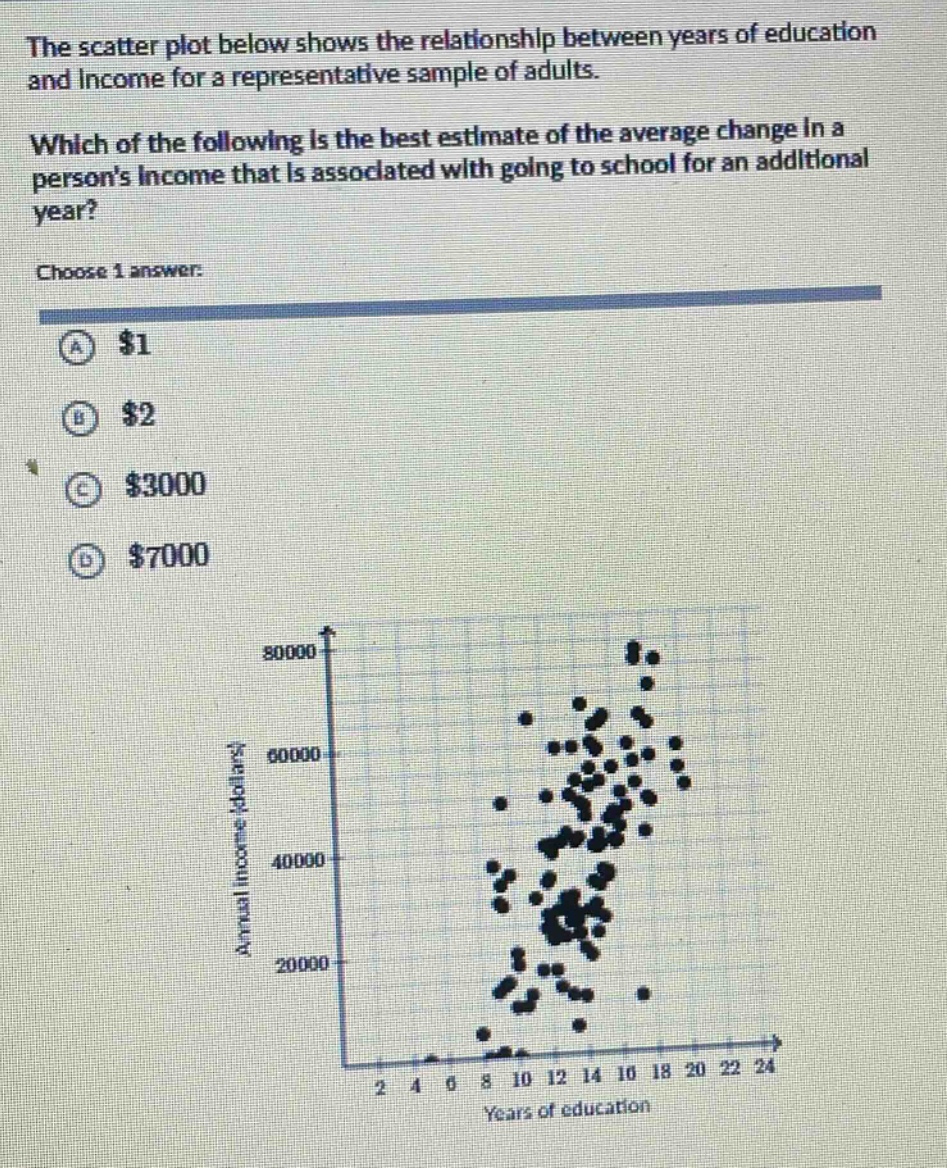
the scatter plot below shows the relationship between years of education and income for a representative sample of adults. which of the following is the best estimate of the average change in a persons income that is associated with going to school for an additional year? choose 1 answer: a $1 b $2 c $3000 d $7000
Answer
Explanation:
Step1: Estimate slope visually
We want to find the average change in income per additional year of education. This is equivalent to finding the slope of the line - of - best - fit for the scatter - plot. Looking at the scatter - plot, when the years of education increase from about 10 to 18 (an increase of $\Delta x=8$ years), the income increases from about $20000$ to $80000$ (an increase of $\Delta y = 60000$).
Step2: Calculate slope
The slope $m$ of a line is given by the formula $m=\frac{\Delta y}{\Delta x}$. Substituting $\Delta y = 60000$ and $\Delta x = 8$ into the formula, we get $m=\frac{60000}{8}=7500$. The closest value to $7500$ among the given options is $7000$.
Answer:
D. $7000$