which scatter plot shows a strong, positive correlation between the variables x and y?
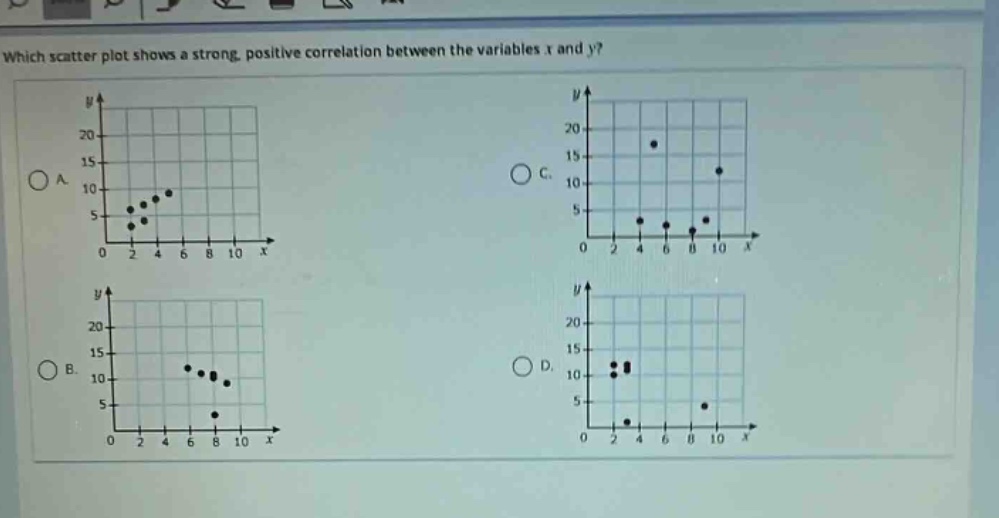
which scatter plot shows a strong, positive correlation between the variables x and y?
Answer
Explanation:
Step1: Understand positive - correlation
In a positive - correlation, as the value of (x) increases, the value of (y) also increases.
Step2: Check for strong correlation
In a strong correlation, the data points are closely clustered around a line. For option A, as (x) increases from 2 to 6, (y) increases from about 5 to 10. The data points are closely grouped around an upward - sloping line. For option B, the data points are more scattered and do not show a clear upward trend as (x) increases. For option C, there is no clear upward trend as (x) increases. For option D, there is no clear upward trend as (x) increases.
Answer:
A.