the scatter plot shows the time gymnasts spend practicing each week and their average scores when competing…
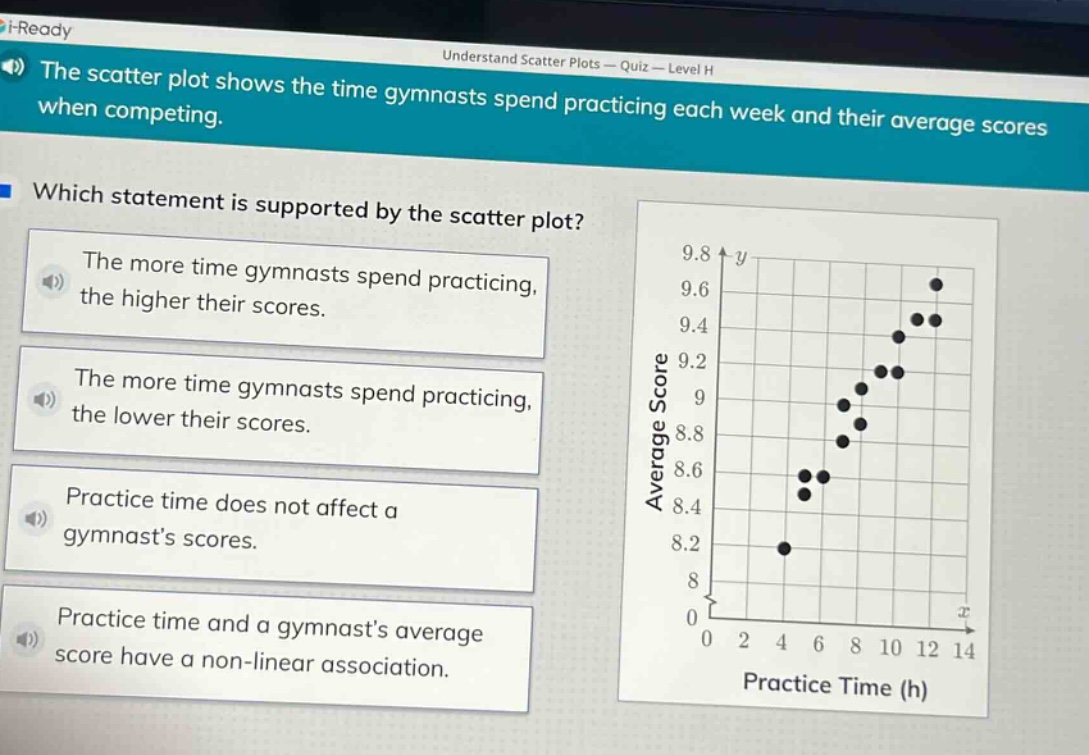
the scatter plot shows the time gymnasts spend practicing each week and their average scores when competing. which statement is supported by the scatter plot? the more time gymnasts spend practicing, the higher their scores. the more time gymnasts spend practicing, the lower their scores. practice time does not affect a gymnasts scores. practice time and a gymnasts average score have a non - linear association.
Answer
Brief Explanations:
Analyze the scatter plot's trend. As practice time (x-axis) increases, average scores (y-axis) generally rise in a roughly linear pattern, indicating a positive correlation. Evaluate each option:
- First option aligns with the upward trend.
- Second option contradicts the trend.
- Third option is false as a trend exists.
- Fourth option is incorrect since the association appears linear, not non-linear.
Answer:
The more time gymnasts spend practicing, the higher their scores.