the scatter plot shows the time spent texting and the time spent exercising by each of 21 students last…
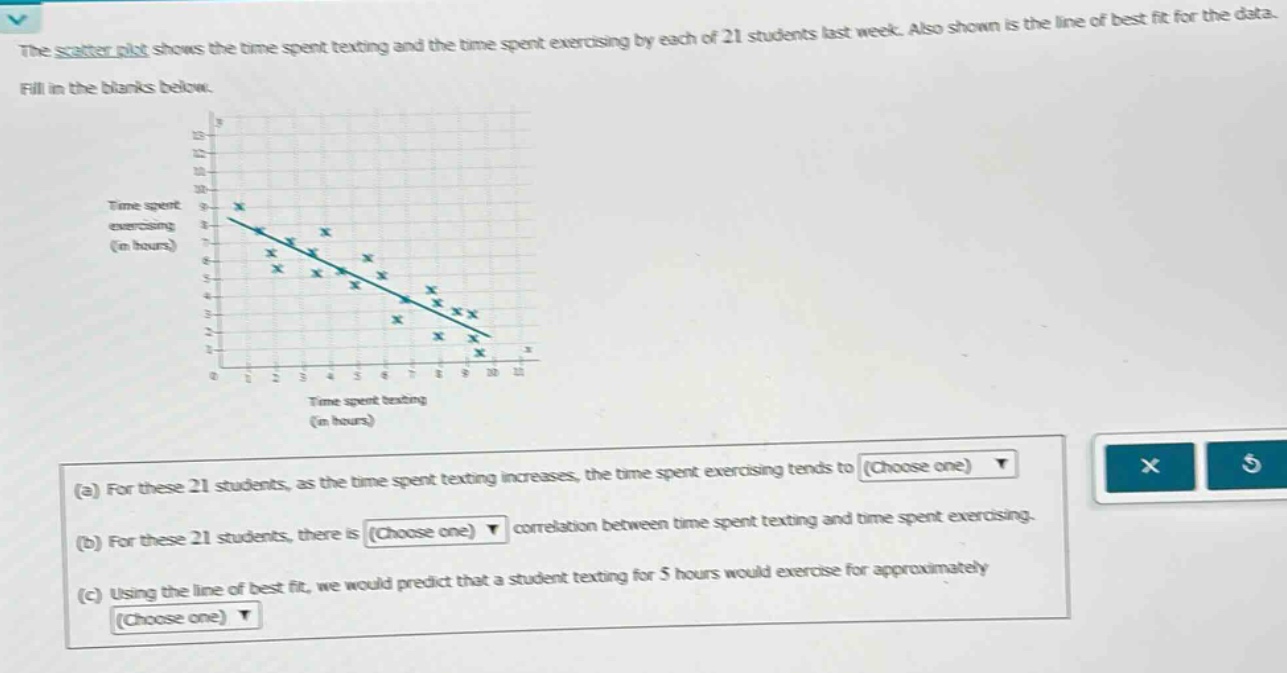
the scatter plot shows the time spent texting and the time spent exercising by each of 21 students last week. also shown is the line of best fit for the data. fill in the blanks below. (a) for these 21 students, as the time spent texting increases, the time spent exercising tends to choose one (b) for these 21 students, there is choose one correlation between time spent texting and time spent exercising. (c) using the line of best fit, we would predict that a student texting for 5 hours would exercise for approximately choose one
Answer
Explanation:
Step1: Analyze scatter - plot trend
As we can see from the scatter - plot, as the time spent texting increases, the time spent exercising decreases.
Step2: Determine correlation type
Since the variables move in opposite directions, there is a negative correlation between time spent texting and time spent exercising.
Step3: Predict value using line of best - fit
Locate (x = 5) on the (x) - axis (time spent texting). Then, find the corresponding (y) - value (time spent exercising) on the line of best - fit. By visual inspection, when (x = 5), (y\approx6).
Answer:
(a) Decrease (b) Negative (c) 6 hours