the scatter plot shows the time spent texting and the time spent exercising by each of 25 students last…
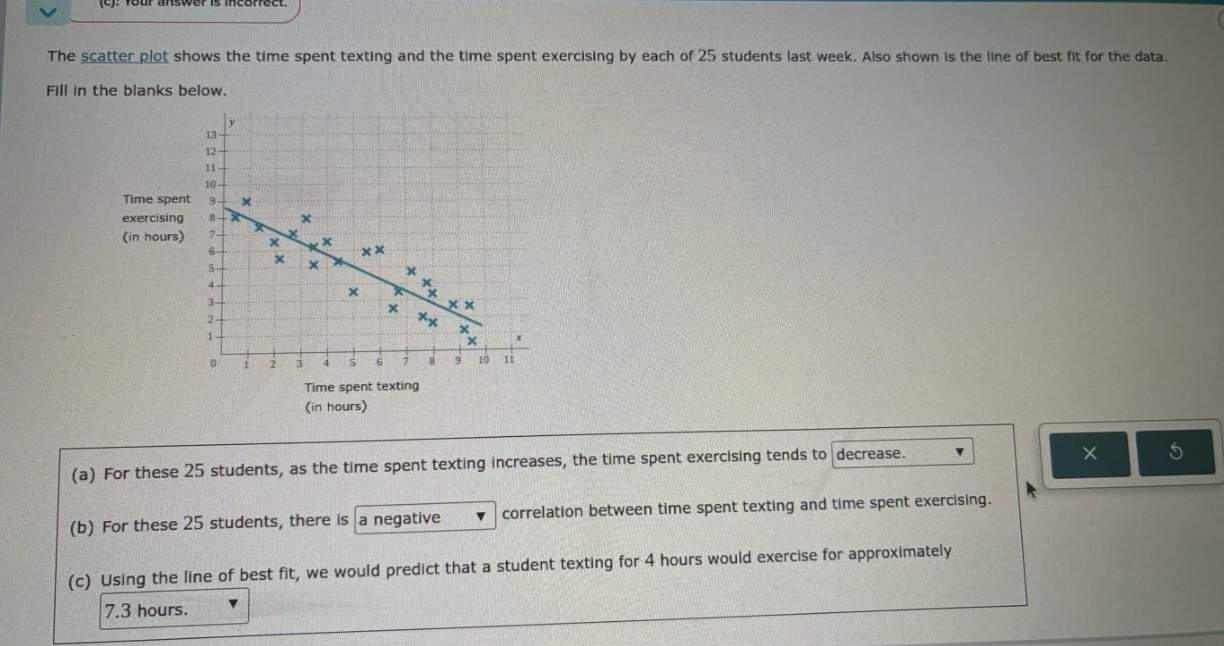
the scatter plot shows the time spent texting and the time spent exercising by each of 25 students last week. also shown is the line of best fit for the data. fill in the blanks below. (a) for these 25 students, as the time spent texting increases, the time spent exercising tends to decrease. (b) for these 25 students, there is a negative correlation between time spent texting and time spent exercising. (c) using the line of best fit, we would predict that a student texting for 4 hours would exercise for approximately 7.3 hours.
Answer
Explanation:
Step1: Locate x - value on line of best fit
Find x = 4 on the x - axis (time spent texting).
Step2: Determine corresponding y - value
Move vertically up to the line of best fit and then horizontally to the y - axis (time spent exercising). Estimate the y - value. Looking at the scatter - plot and line of best fit, when x = 4, y is approximately 6.
Answer:
6 hours