there are 4 scatter plots shown above. which one shows the most accurate line of best fit? a w b x c y d z
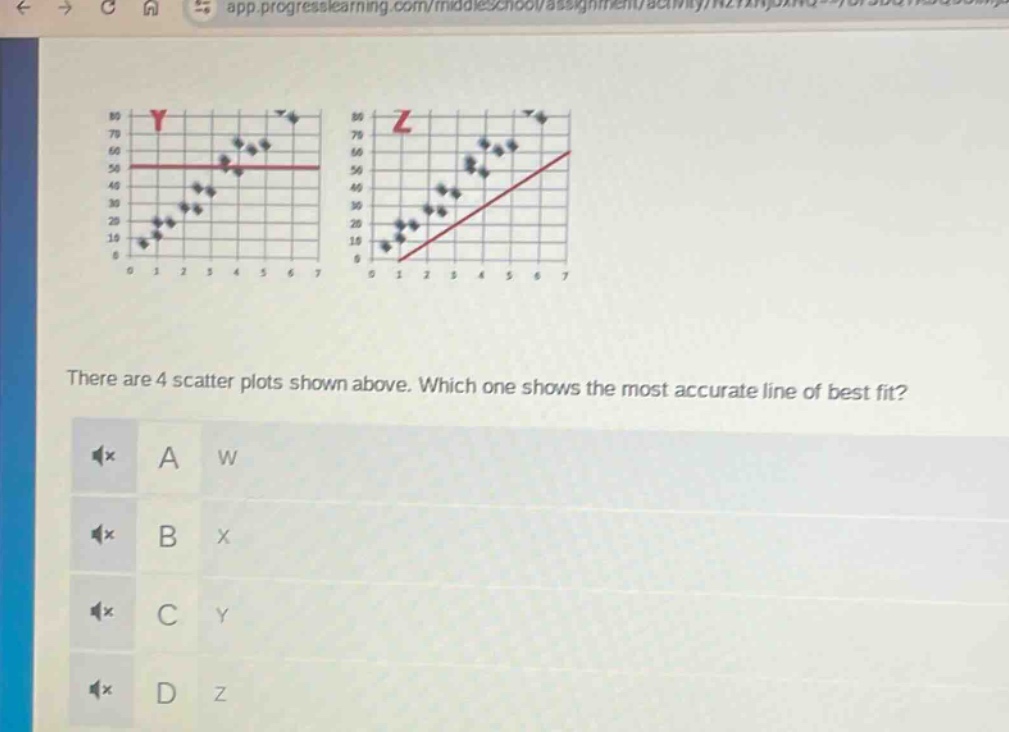
there are 4 scatter plots shown above. which one shows the most accurate line of best fit? a w b x c y d z
Answer
Explanation:
Step1: Understand line - of - best - fit concept
The line of best fit should minimize the distance between the points in the scatter - plot and the line.
Step2: Analyze each scatter - plot
In scatter - plot Z, the points are closely clustered around the line, indicating that the line represents the relationship between the variables well. In scatter - plot Y, the line is horizontal and does not follow the upward trend of the points. For the other unspecified scatter - plots (W and X not shown in detail here), based on the given Z and Y, Z has a better fit as the points are more aligned with the line.
Answer:
D. Z