a scatterplot consists of (1, 4.0), (2, 3.3), (3, 3.8), (4, 2.6), and (5, 2.7). the line of best fit used to…
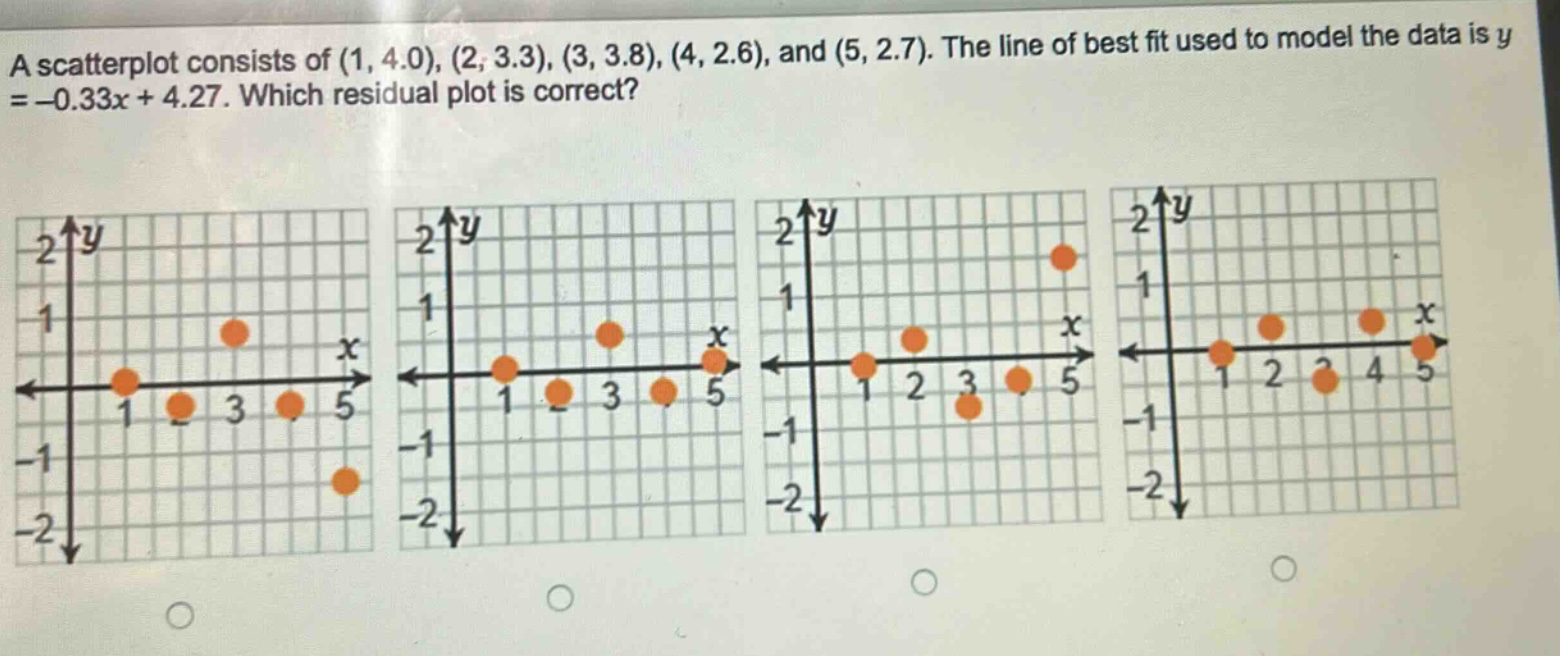
a scatterplot consists of (1, 4.0), (2, 3.3), (3, 3.8), (4, 2.6), and (5, 2.7). the line of best fit used to model the data is y = -0.33x + 4.27. which residual plot is correct?
Answer
Explanation:
Step1: Recall residual formula
Residual = Observed - Predicted.
Step2: Calculate predicted values
For $x = 1$, $y_{pred}=-0.33\times1 + 4.27=3.94$. Residual for $(1,4.0)$ is $4.0 - 3.94 = 0.06$. For $x = 2$, $y_{pred}=-0.33\times2+4.27 = 3.61$. Residual for $(2,3.3)$ is $3.3 - 3.61=- 0.31$. For $x = 3$, $y_{pred}=-0.33\times3 + 4.27=3.28$. Residual for $(3,3.8)$ is $3.8 - 3.28 = 0.52$. For $x = 4$, $y_{pred}=-0.33\times4+4.27 = 2.95$. Residual for $(4,2.6)$ is $2.6 - 2.95=-0.35$. For $x = 5$, $y_{pred}=-0.33\times5+4.27 = 2.62$. Residual for $(5,2.7)$ is $2.7 - 2.62 = 0.08$.
Step3: Analyze residual plot
The $x$-axis of the residual - plot is the $x$-values from the data points, and the $y$-axis is the residual values. We need to plot the points $(1,0.06),(2, - 0.31),(3,0.52),(4,-0.35),(5,0.08)$.
Answer:
The correct residual - plot is the one that has points corresponding to the calculated residual values for the given $x$ - values. Without the ability to directly select from the provided plots, you would look for a plot with points at approximately $(1,0.06)$ (a small positive value near $x = 1$), $(2,-0.31)$ (a negative value near $x = 2$), $(3,0.52)$ (a positive value near $x = 3$), $(4,-0.35)$ (a negative value near $x = 4$), and $(5,0.08)$ (a small positive value near $x = 5$).