the scatterplot contains data points, pairing the age of a child (x) with the childs weight (y). using the…
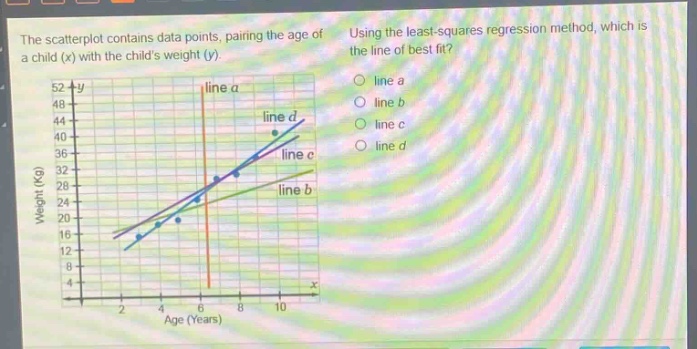
the scatterplot contains data points, pairing the age of a child (x) with the childs weight (y). using the least - squares regression method, which is the line of best fit? line a line b line c line d
Answer
Explanation:
Step1: Understand least - squares regression
The line of best fit in least - squares regression minimizes the sum of the squared vertical distances between the data points and the line.
Step2: Visual inspection
We look for a line that passes as close as possible to most of the data points. Line $d$ appears to be the one that minimizes the overall vertical distances from the data points compared to lines $a$, $b$, and $c$. Line $a$ is a vertical line and does not represent a relationship between age and weight. Line $b$ is below many of the data points. Line $c$ also does not fit the data points as well as line $d$.
Answer:
line d