the scatterplot and regression line below show the average income, in dollars, in several major american…
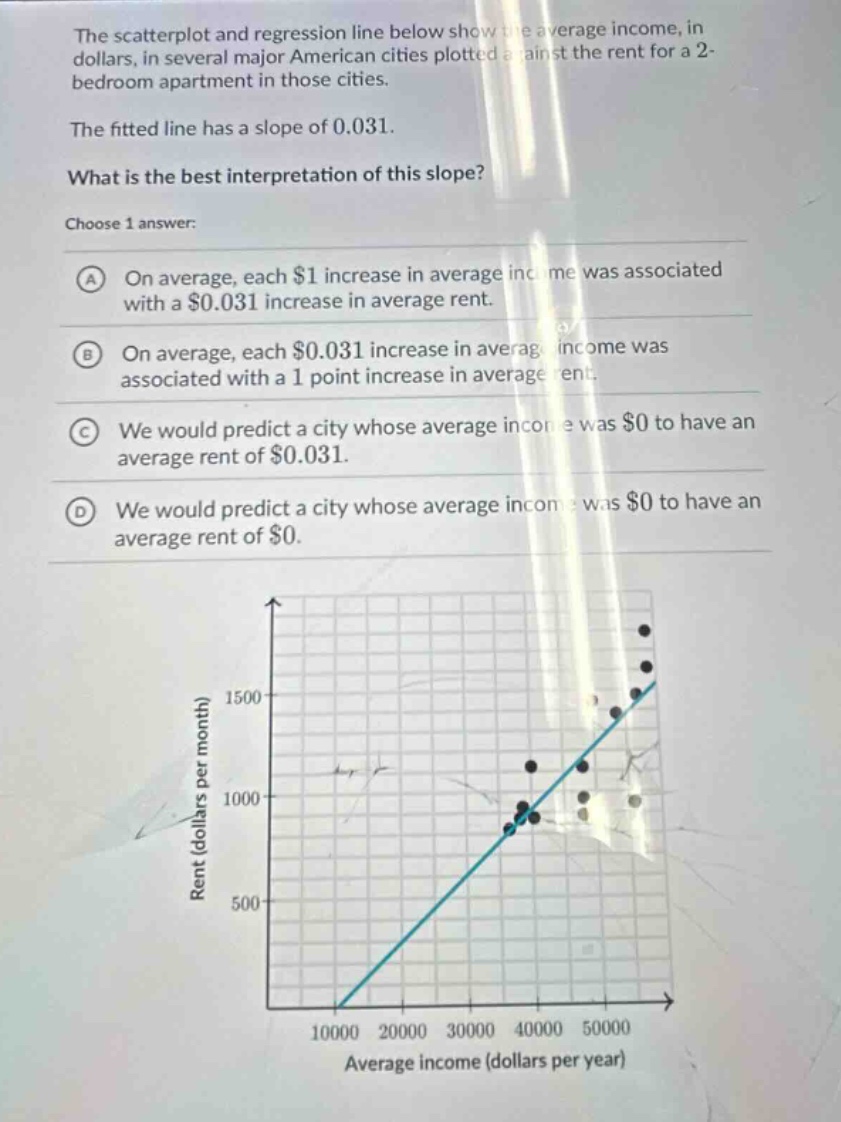
the scatterplot and regression line below show the average income, in dollars, in several major american cities plotted against the rent for a 2 - bedroom apartment in those cities. the fitted line has a slope of 0.031. what is the best interpretation of this slope? choose 1 answer: a on average, each $1 increase in average income was associated with a $0.031 increase in average rent. b on average, each $0.031 increase in average income was associated with a 1 point increase in average rent. c we would predict a city whose average income was $0 to have an average rent of $0.031. d we would predict a city whose average income was $0 to have an average rent of $0.
Answer
Brief Explanations:
The slope of a regression - line in a context where one variable (average income) is plotted against another (average rent) represents the change in the response variable (average rent) for a one - unit change in the explanatory variable (average income). Here, for every $1 increase in average income, the average rent increases by $0.031 on average.
Answer:
A. On average, each $1 increase in average income was associated with a $0.031 increase in average rent.