the scatterplot and regression line below show the relationship between how early students turned in an exam…
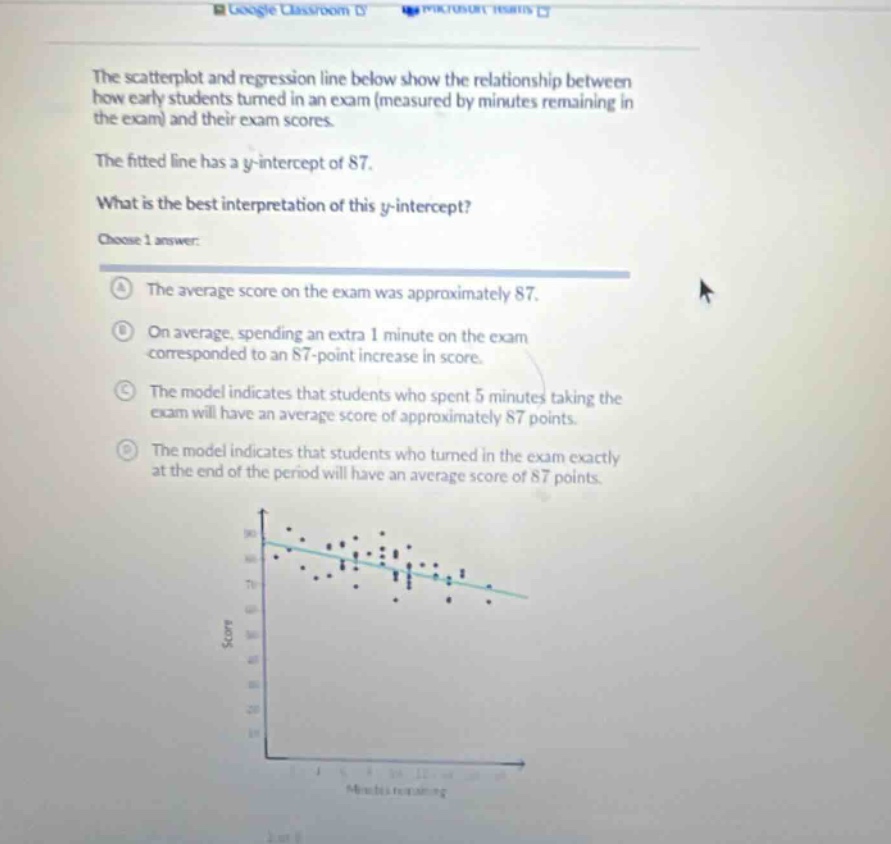
the scatterplot and regression line below show the relationship between how early students turned in an exam (measured by minutes remaining in the exam) and their exam scores. the fitted line has a y - intercept of 87. what is the best interpretation of this y - intercept? choose 1 answer: a the average score on the exam was approximately 87. b on average, spending an extra 1 minute on the exam corresponded to an 87 - point increase in score. c the model indicates that students who spent 5 minutes taking the exam will have an average score of approximately 87 points. d the model indicates that students who turned in the exam exactly at the end of the period will have an average score of 87 points.
Answer
Brief Explanations:
The y - intercept of a regression line in this context is the value of the response variable (exam score) when the explanatory variable (minutes remaining in the exam) is zero. Zero minutes remaining means students turn in the exam at the end of the period.
Answer:
D. The model indicates that students who turned in the exam exactly at the end of the period will have an average score of 87 points.