the scatterplot for a set of data points is shown, along with the line of best fit. choose the best estimate…
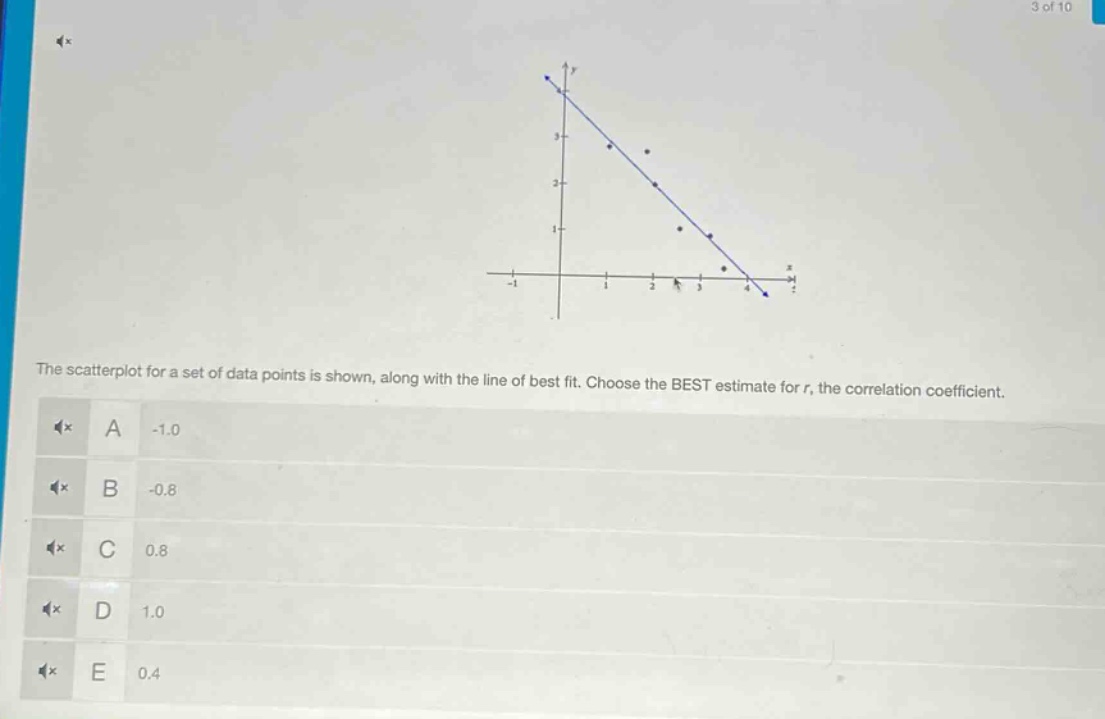
the scatterplot for a set of data points is shown, along with the line of best fit. choose the best estimate for r, the correlation coefficient.\na -1.0\nb -0.8\nc 0.8\nd 1.0\ne 0.4
Answer
Explanation:
Step1: Analyze the slope of the line of best - fit
The line of best - fit has a negative slope, so the correlation coefficient $r$ is negative. This eliminates options C, D, and E.
Step2: Assess the strength of the linear relationship
The data points are closely clustered around the line of best - fit. A value of $r=- 1$ indicates a perfect negative linear relationship, and while this is not a perfect fit, it is a strong negative linear relationship. A value of $r = - 0.8$ represents a strong negative linear relationship, and it is a better estimate than $r=-1$ for this scatter - plot.
Answer:
B. -0.8