the scatterplot shows the depth of water in swimming pools, y, based on the days after filling, x. what can…
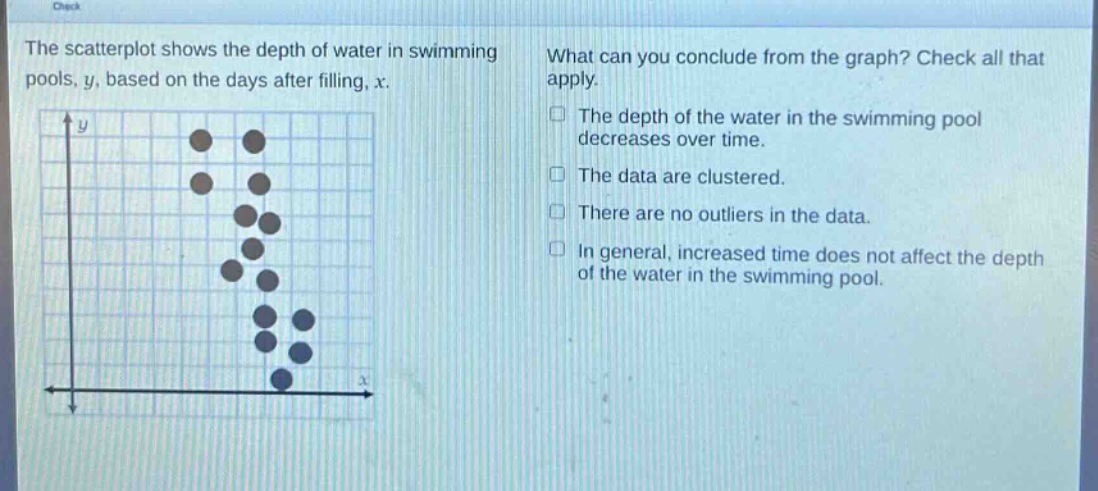
the scatterplot shows the depth of water in swimming pools, y, based on the days after filling, x. what can you conclude from the graph? check all that apply. the depth of the water in the swimming pool decreases over time. the data are clustered. there are no outliers in the data. in general, increased time does not affect the depth of the water in the swimming pool.
Answer
Brief Explanations:
- Analyze the scatter - plot trend: As the number of days after filling (x) increases, the depth of water (y) generally goes down, so the depth of water decreases over time.
- Observe data distribution: The points are grouped together, indicating data is clustered.
- Check for outliers: No points are far from the cluster, so there are no outliers.
- Evaluate time - depth relationship: Since depth decreases with time, increased time does affect the depth.
Answer:
The depth of the water in the swimming pool decreases over time. The data are clustered. There are no outliers in the data.