the scatterplot shows the distance (in feet) that a person was from a motion sensor during an experiment in…
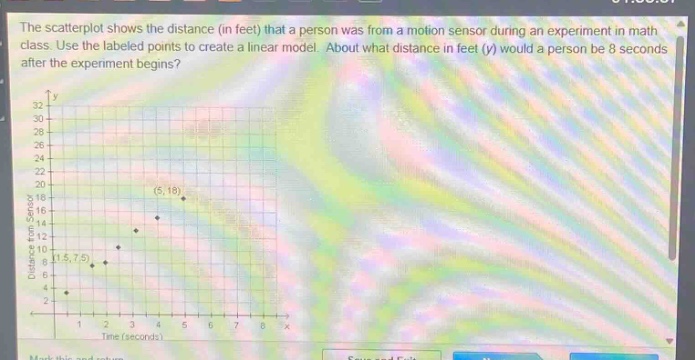
the scatterplot shows the distance (in feet) that a person was from a motion sensor during an experiment in math class. use the labeled points to create a linear model. about what distance in feet (y) would a person be 8 seconds after the experiment begins?
Answer
Explanation:
Step1: Find the slope formula
The slope $m$ of a line passing through two points $(x_1,y_1)$ and $(x_2,y_2)$ is $m=\frac{y_2 - y_1}{x_2 - x_1}$. Let $(x_1,y_1)=(1.5,7.5)$ and $(x_2,y_2)=(5,18)$. Then $m=\frac{18 - 7.5}{5 - 1.5}=\frac{10.5}{3.5}=3$.
Step2: Find the y - intercept formula
The equation of a line is $y=mx + b$. Using the point $(1.5,7.5)$ and $m = 3$, we substitute into the equation: $7.5=3\times1.5 + b$. Solving for $b$ gives $b=7.5-4.5 = 3$. So the linear equation is $y = 3x+3$.
Step3: Calculate the distance at $x = 8$
Substitute $x = 8$ into the equation $y=3x + 3$. Then $y=3\times8+3=24 + 3=27$.
Answer:
27