3. the scatterplot shows the height in centimeters and weight in kilograms of several students. based on the…
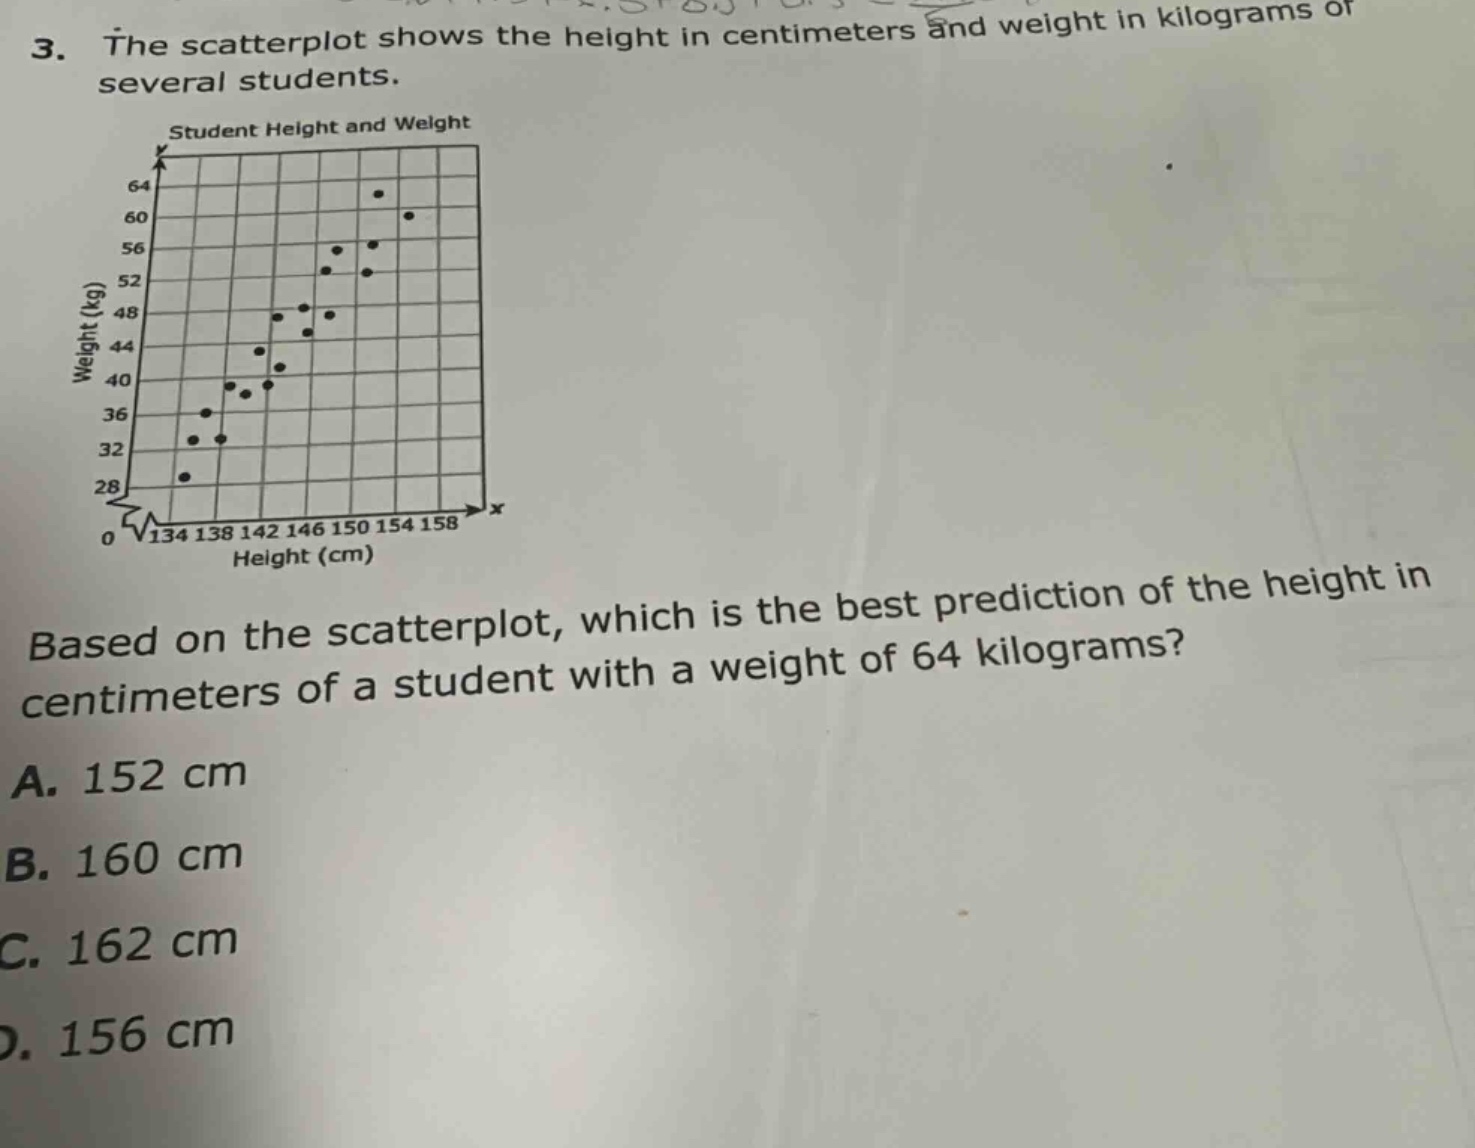
3. the scatterplot shows the height in centimeters and weight in kilograms of several students. based on the scatterplot, which is the best prediction of the height in centimeters of a student with a weight of 64 kilograms? a. 152 cm b. 160 cm c. 162 cm d. 156 cm
Answer
Explanation:
Step1: Observe the scatter - plot trend
The scatter - plot shows a positive correlation between height and weight.
Step2: Locate the weight value
Locate the weight of 64 kg on the y - axis of the scatter - plot.
Step3: Estimate the corresponding height
Based on the trend of the data points, estimate the corresponding x - value (height). As we move up the y - axis to 64 kg, the corresponding x - value is around 160 cm.
Answer:
B. 160 cm