the scatterplot shows the number of athletes on the field hockey and tennis teams at southern high school…
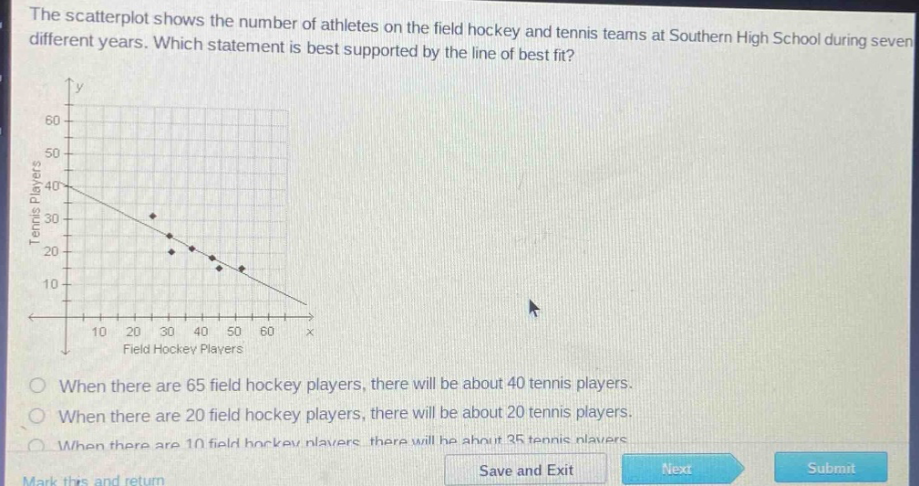
the scatterplot shows the number of athletes on the field hockey and tennis teams at southern high school during seven different years. which statement is best supported by the line of best fit? when there are 65 field hockey players, there will be about 40 tennis players. when there are 20 field hockey players, there will be about 20 tennis players. when there are 10 field hockey players, there will be about 35 tennis players.
Answer
Explanation:
Step1: Analyze the line - of - best - fit trend
The line of best fit has a negative slope, meaning as the number of field hockey players increases, the number of tennis players decreases.
Step2: Check each option
For the option "When there are 65 field hockey players, there will be about 40 tennis players": Looking at the line of best fit, when (x = 65) (field hockey players), the (y) - value (tennis players) is much less than 40. For the option "When there are 20 field hockey players, there will be about 20 tennis players": From the line of best fit, when (x = 20), the (y) - value is around 30, not 20. For the option "When there are 10 field hockey players, there will be about 35 tennis players": By observing the line of best fit, when (x = 10), the (y) - value is approximately 35.
Answer:
When there are 10 field hockey players, there will be about 35 tennis players.