the scatterplot shows the number of guests who visited a hotel pool and the temperature on those days…
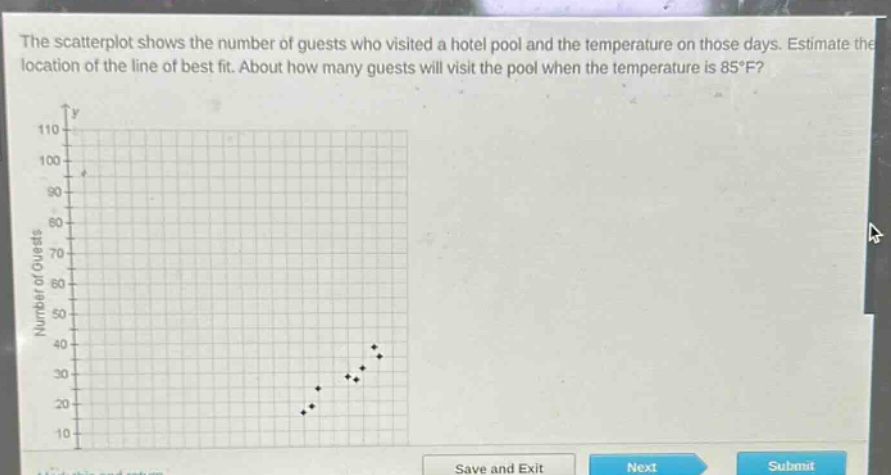
the scatterplot shows the number of guests who visited a hotel pool and the temperature on those days. estimate the location of the line of best fit. about how many guests will visit the pool when the temperature is 85°f?
Answer
Explanation:
Step1: Visualize line of best fit
Draw a line that best represents the trend of the data points on the scatter - plot.
Step2: Locate x - value on line
Find the value of (x = 85) (temperature) on the x - axis and then move vertically until it intersects the line of best fit.
Step3: Read corresponding y - value
From the intersection point, move horizontally to the y - axis to read the number of guests. By estimating from the scatter - plot, when (x = 85), the corresponding (y) value (number of guests) is around 70.
Answer:
70