the scatterplot shows the number of home runs mario hits during his first four seasons on the company…
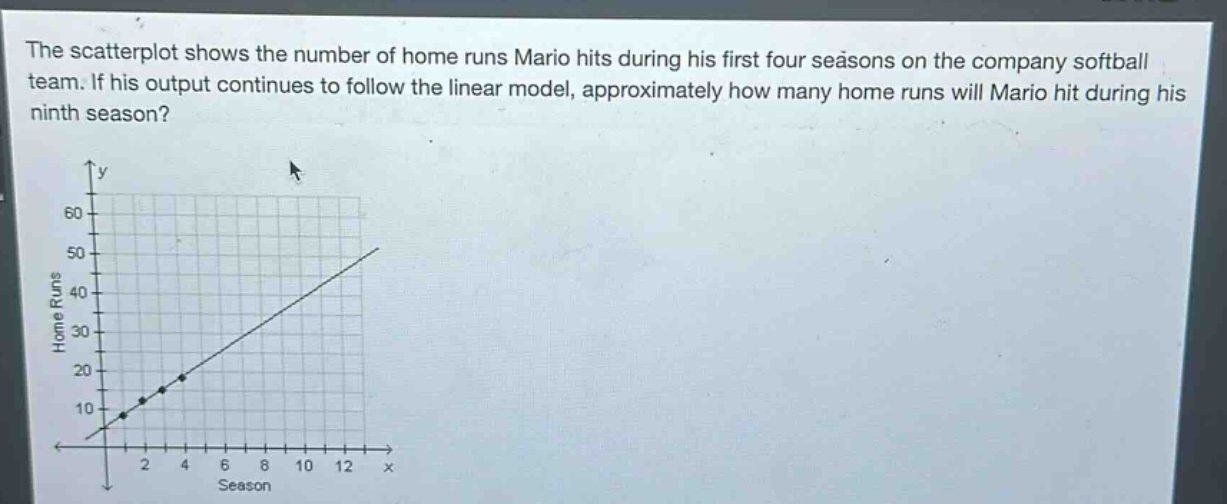
the scatterplot shows the number of home runs mario hits during his first four seasons on the company softball team. if his output continues to follow the linear model, approximately how many home runs will mario hit during his ninth season?
Answer
Explanation:
Step1: Find the slope of the line
We can choose two points on the line, say (1, 5) and (3, 15). The slope formula is $m=\frac{y_2 - y_1}{x_2 - x_1}$. So $m=\frac{15 - 5}{3 - 1}=\frac{10}{2}=5$.
Step2: Find the y - intercept
Using the point - slope form $y - y_1=m(x - x_1)$ with the point (1, 5) and $m = 5$, we have $y-5 = 5(x - 1)$. Expanding gives $y-5=5x-5$, so $y = 5x$ (the y - intercept $b = 0$).
Step3: Predict for the ninth season
Substitute $x = 9$ into the equation $y = 5x$. Then $y=5\times9 = 45$.
Answer:
45