the scatterplot below shows the relationship between the length of a long - distance phone call and the cost…
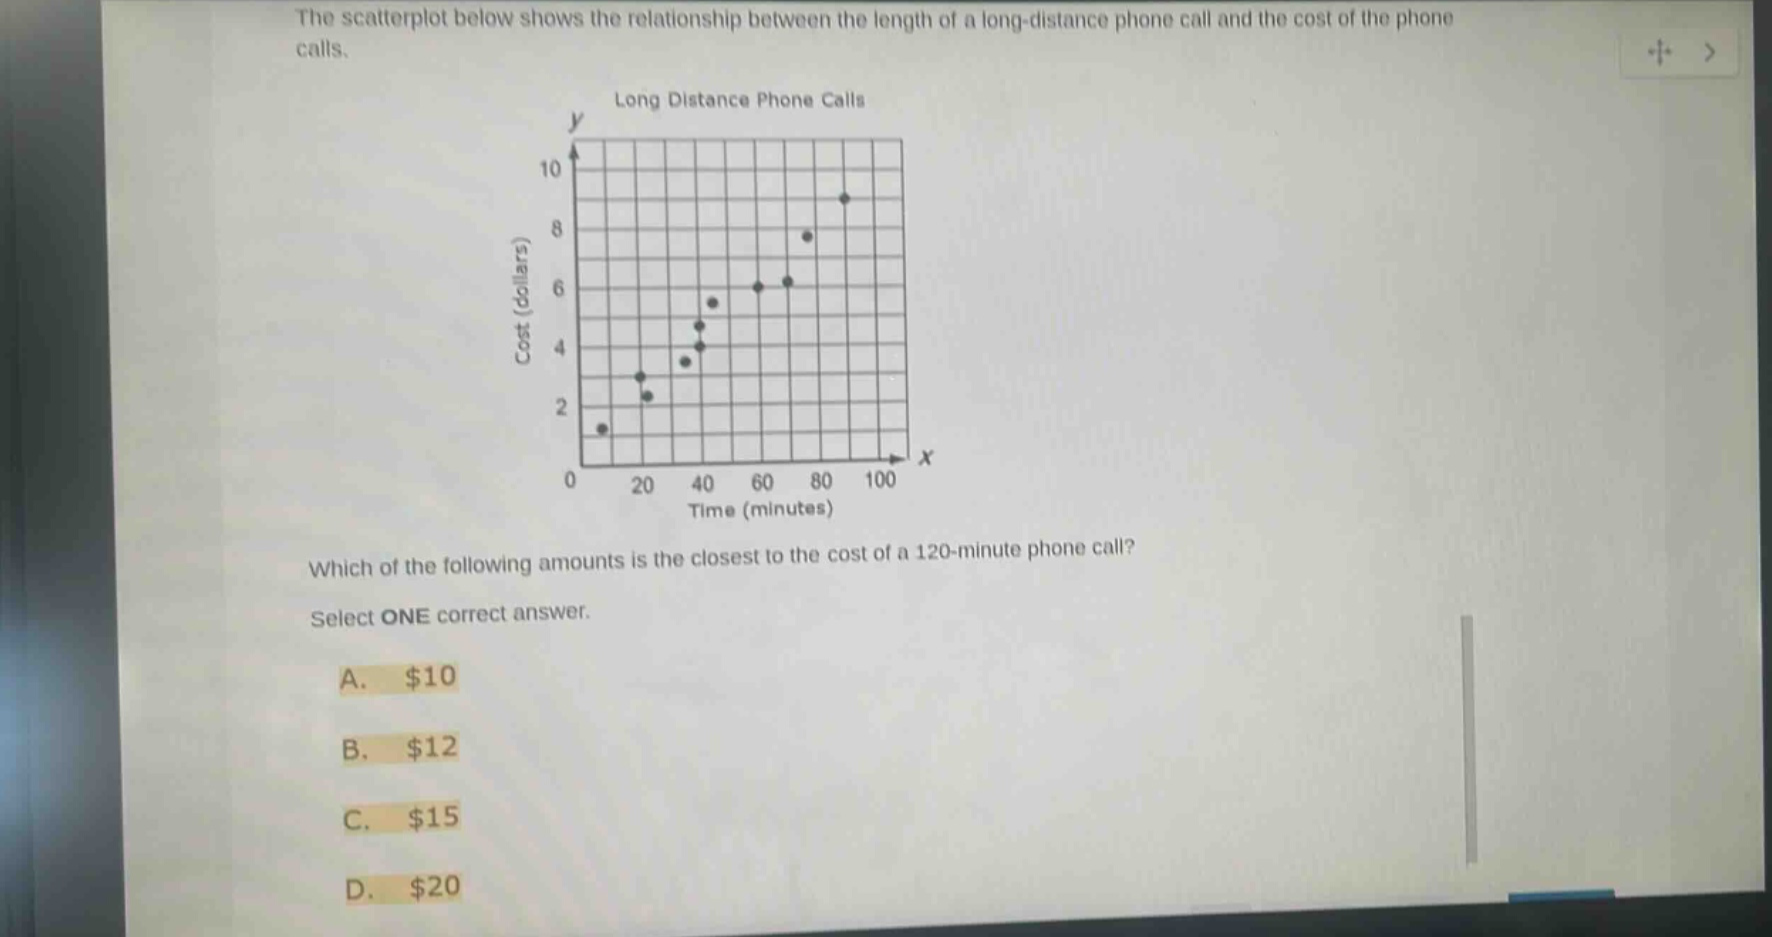
the scatterplot below shows the relationship between the length of a long - distance phone call and the cost of the phone calls.\nlong distance phone calls\nwhich of the following amounts is the closest to the cost of a 120 - minute phone call?\nselect one correct answer.\na. $10\nb. $12\nc. $15\nd. $20
Answer
Explanation:
Step1: Observe the trend
The scatter - plot shows a positive linear trend. As the time increases, the cost increases.
Step2: Estimate the trend
We can roughly draw a line of best - fit through the points. When (x = 100), (y) is around 9. The cost seems to increase at a relatively constant rate.
Step3: Extrapolate
Assuming a linear relationship, if we consider the increase from (x = 100) to (x = 120) (an increase of 20 in (x)). Looking at the trend, for an increase of about 20 in (x) (from previous intervals), the increase in (y) is around 1. So when (x = 120), (y) is around (9 + 1=10).
Answer:
A. $10